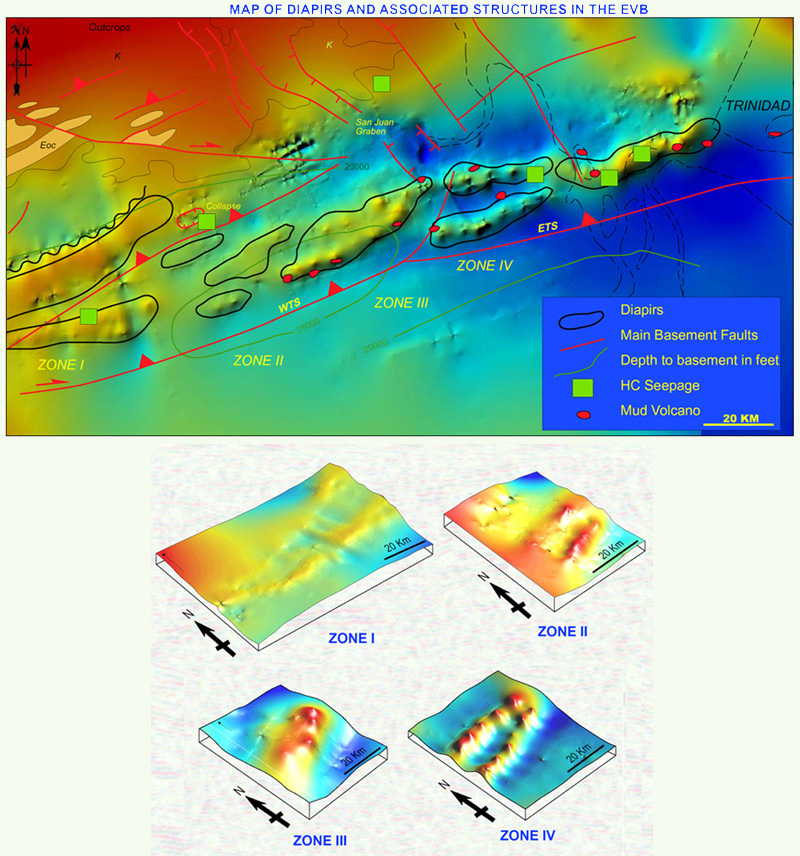
Figure 3-1. Composite map showing the seismic image extrapolated from 2D seismic data, surface geology and regional faults. The map was prepared using the base of Pliocene. Note the shape of diapirs in Zone I, slightly curved in the extreme west and the mirror image on Zone III slightly curved northeastward. The map shows the coincidence of thrusting and diapirism. Note also the appearance of normal faulting in the north of Zone II and IV.