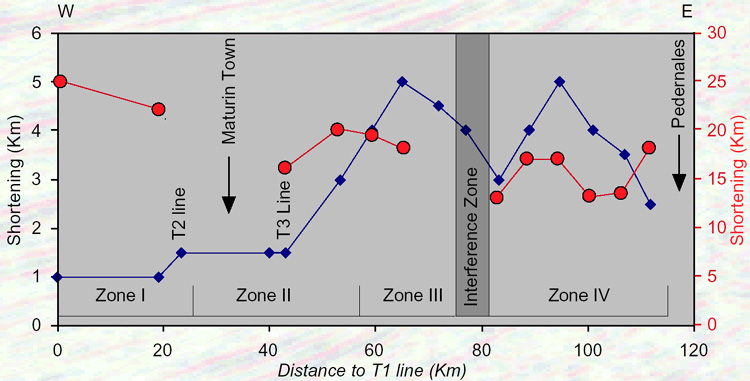
Figure 2-1. Plot of net shortening of the diapirs at base of Pliocene (black rhombus) and under the shale at Top of Cretaceous (red circles) measured in the plane of the profile. The diagram indicates different amounts of shortening for the Pliocene and Cretaceous units depending on the location of the line in the Basin . Note that shortening in Cretaceous units is larger in the West than in the East, and the shortening in the Pliocene Units is greater on the east.