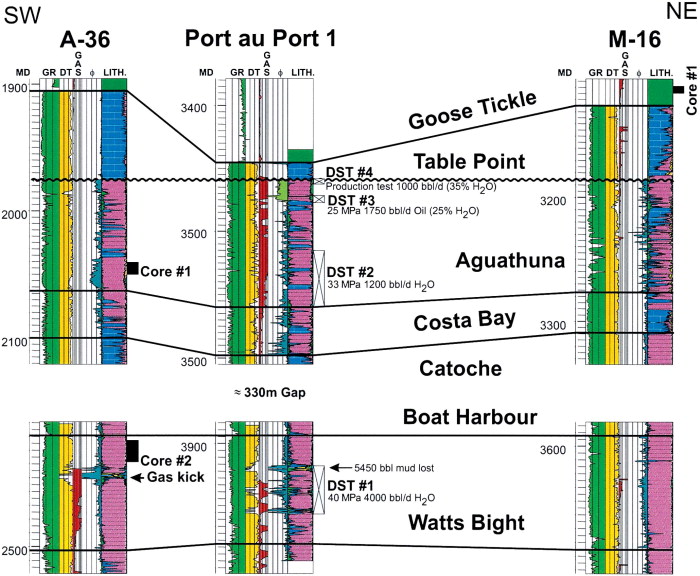
Figure 16. Log correlation of stratigraphic formations between the St. George's Bay A-36, Port au Port 1, and Long Point M-16 wells. MD = measured depth in meters; GR = gamma ray in API units; DT = sonic in microsecs/meter; GAS = total mud gas in units; f = porosity % (blue = water-filled; green = oil-filled); LITH = calculated lithology (green = shale; blue = limestone; pink = dolomite). Locations of cores and DST intervals are shown.