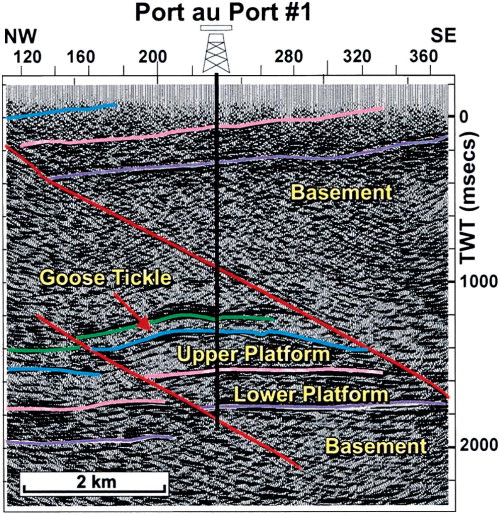
Figure 6. Seismic line HOC-TER-CAH-93-5 showing the structure tested by the Port au Port 1 well. For line location see Figure 5. Green = base Lourdes Formation; blue = top Table Point Formation; pink = Campbells Member, Petit Jardin Formation; lilac = top basement. Faults are shown in red.