For higher resolution, click with cursor over image.
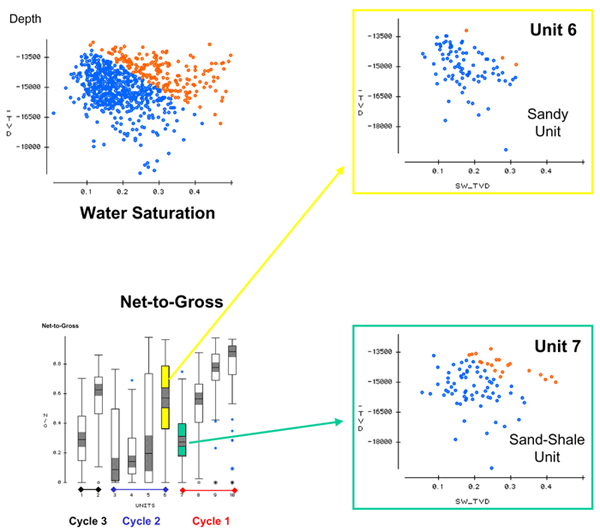
Figure 21. Water saturation depth trend analysis using an arbitrary cut-off varying with depth.
For higher resolution, click with cursor over image.
Figure 21. Water saturation depth trend analysis using an arbitrary cut-off varying with depth.