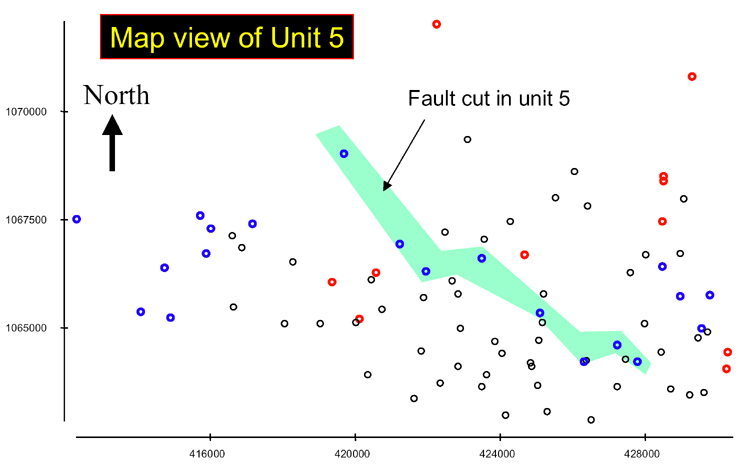
Figure 8. Crossplot of thickness ratios (normal [black circles] and abnormal values) on map, with position of fault where Unit 5 is cut by it.
Figure 8. Crossplot of thickness ratios (normal [black circles] and abnormal values) on map, with position of fault where Unit 5 is cut by it.