Print this page
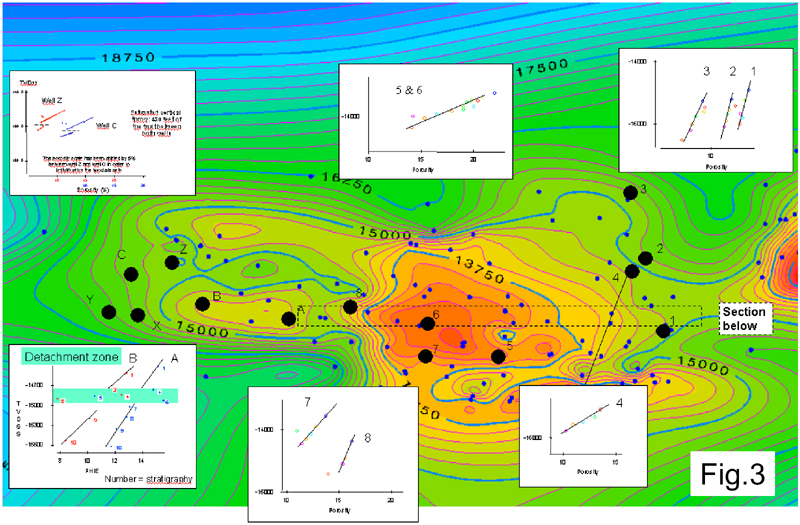
Figure 3. Porosity-depth trends superposed on structure map, Santa Barbara Field. See Figure 17 for detailed plots.