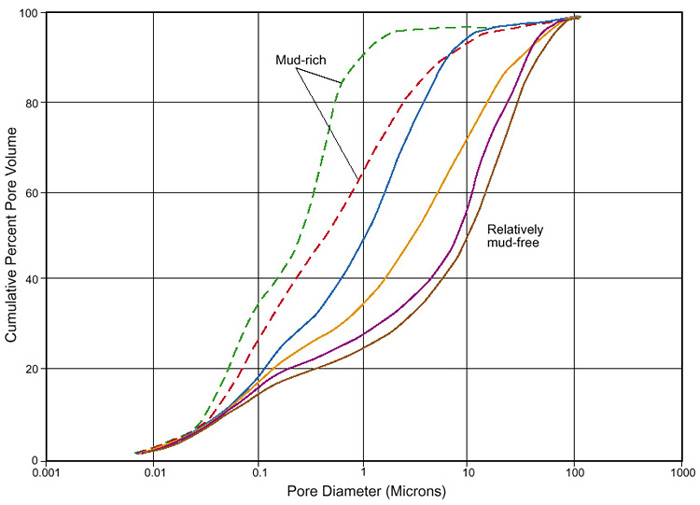
Figure 12: Typical cumulative pore size distribution curves for representative rock types in the Arab-D from mercury injection capillary pressure data. The samples shown here range from relatively mud-free (solid curves) to mud-rich (dashed curves) rocks, yet all have a significant proportion of their total pore volume contributed by pores less than 10 microns in size. In all samples examined in this study, microporosity (pores less than 10 microns in size) is volumetrically significant.