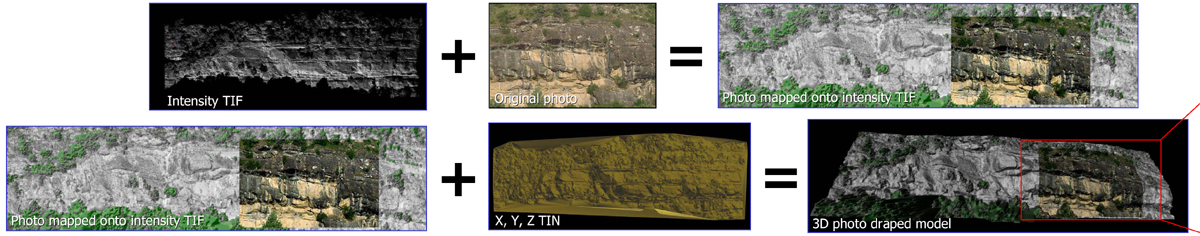
Figure 2-3. Intensity images of that part of Ainsa 2 outcrop outlined (blue) in Figure 2-2; intensity TIF combined with original photo, and photo mapped onto intensity TIF, combined with x, y, z TIN, to yield 3D photo draped model. The green pixels in the intensity images are keyed to a linear cutoff of intensity values coded to display as green. Detail of area within red rectangle is shown in Figure 2-4.