Click on image to view enlargement.
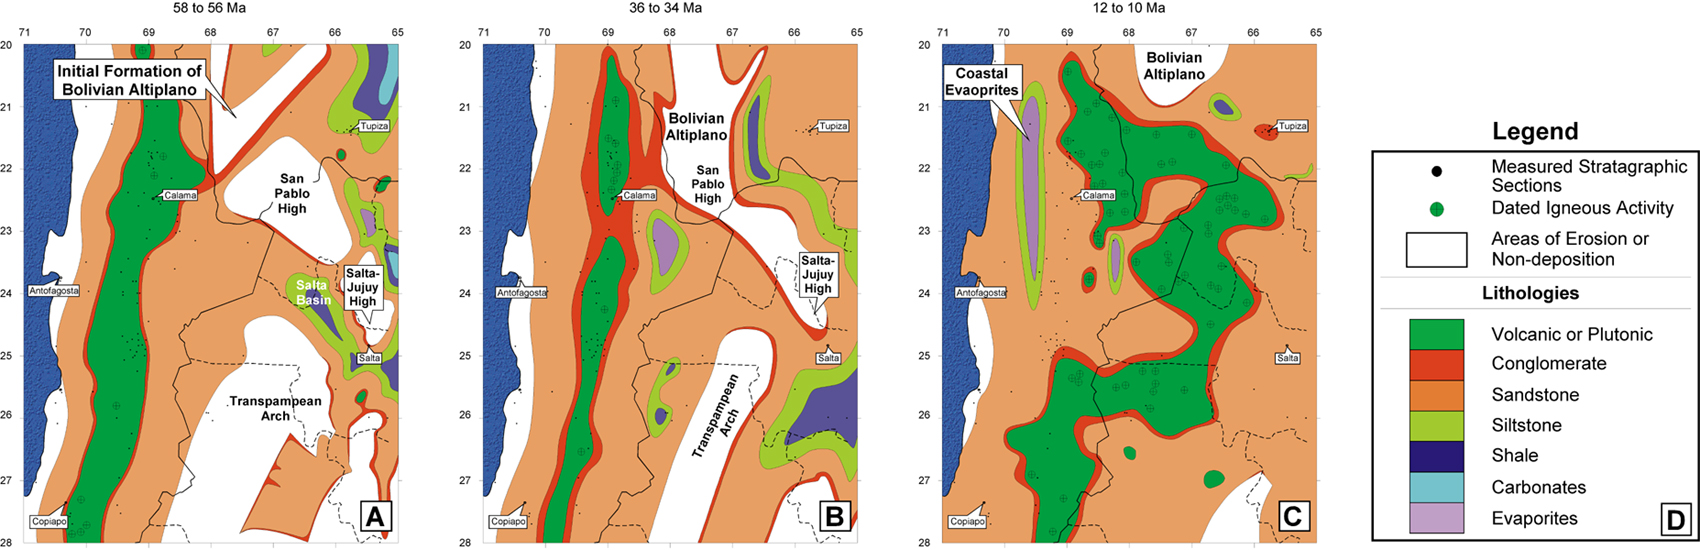
Figure 7. Lithologic maps of strata from the Tertiary Period representing 2-million-year increments. A) 58 to 56 Ma; B) 36 to 34 Ma; C) 12 to 10 Ma; D) legend for the lithologies used in this figure.
Click on image to view enlargement.
Figure 7. Lithologic maps of strata from the Tertiary Period representing 2-million-year increments. A) 58 to 56 Ma; B) 36 to 34 Ma; C) 12 to 10 Ma; D) legend for the lithologies used in this figure.