Click on image to view enlargement.
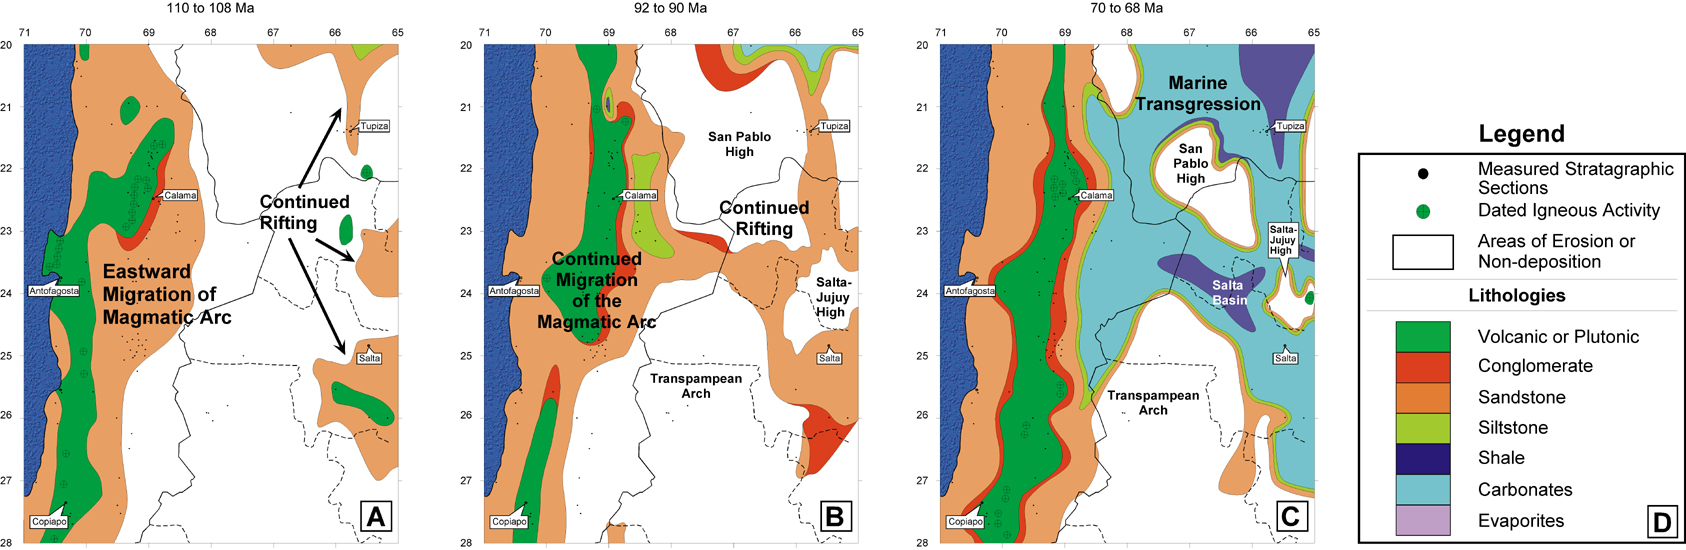
Figure 6. Lithologic maps of strata from the Cretaceous Period representing 2 million-year-increments. A) 110 to 108 Ma; B) 92 to 90 Ma; C) 70 to 68 Ma; D) legend for the lithologies used in this figure.
Click on image to view enlargement.
Figure 6. Lithologic maps of strata from the Cretaceous Period representing 2 million-year-increments. A) 110 to 108 Ma; B) 92 to 90 Ma; C) 70 to 68 Ma; D) legend for the lithologies used in this figure.