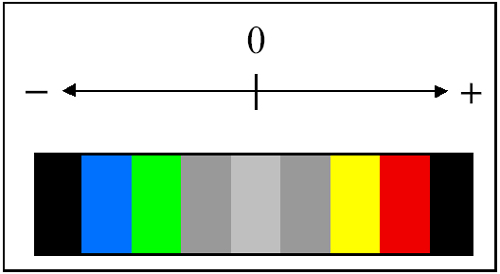
Figure 5. Color bar for Figures 3,4,6,7, and 8. Colors in Figures 3 and 4 indicate, respectively, the sign and magnitude of perturbations in impedance and Poisson’s Ratio. These perturbations are with respect to background values. Colors in Figure 6 signify the sign and magnitude of reflection amplitudes.