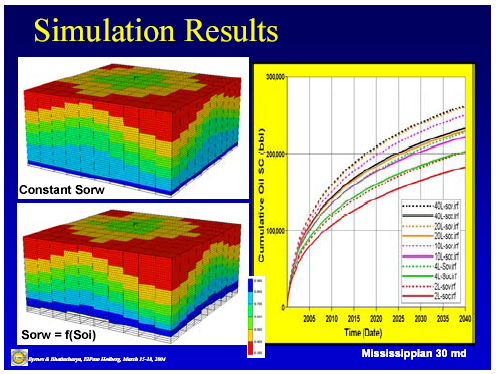
Figure 9. Simulation predicted recovery for a 30 md Mississippian rock comparing recoveries predicted for constant Soi, Sorw (Soc) models and variable Soi, Sorw (Sov) models and for different numbers of layers. Color figure illustrates the improved recovery in the lowermost transition zone with variable Kr curves. Increasing the number of layers increases predicted recovery.