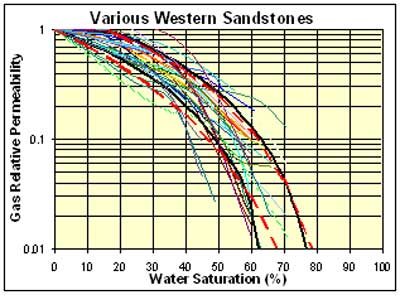
Figure 1. Gas relative permeability curves for various western sandstones from Byrnes (2003). The bounding black curves represent curves constructed using equations 3 through 6 for rocks of 0.001 md and 1 md, representing the approximate upper and low limits of the samples for which curves are shown. Sgc = 0.3 and 0.15 for kik = 0.001 md and 1 md, respectively. Bounding red curves represent Eq. 3 with Sgc = 0.1 and p = 2.8 for kik=0.001md and p=2 for kik =1 md, respectively.