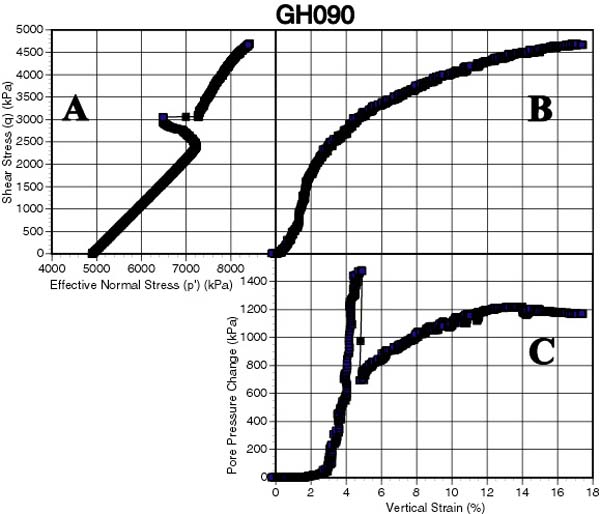
Figure 3 - Shear strength results for a clayey silt sample containing methane gas hydrate tested using GHASTLI. Individual plots are: (A) shear stress (q) versus effective normal stress (p') on a plane inclined at 45 degrees from the horizontal; (B) shear stress versus strain, and (C) change in pore pressure versus strain. The abrupt offsets in Fig. 3A and Fig. 3C are caused by a rapid decrease in measured pore pressure at the base of the test specimen. Pore pressure increased a smaller amount at the top of the specimen and did not exhibit a similar, abrupt decrease.