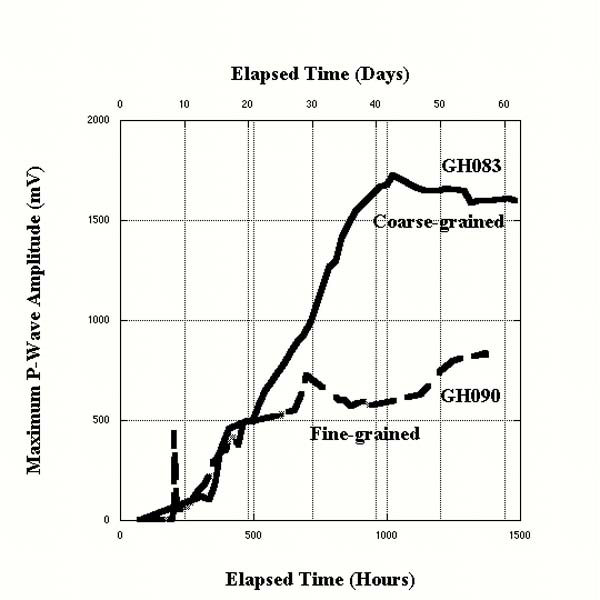
Figure 2 - Maximum P-wave amplitudes versus elapsed time for clayey silt (GH090) and sieved Ottawa sand (GH083) samples. Note the abrupt spike in amplitude for GH090 at initial gas hydrate formation (approximately 198.6 hours) followed by a steady increase for the rest of the test.