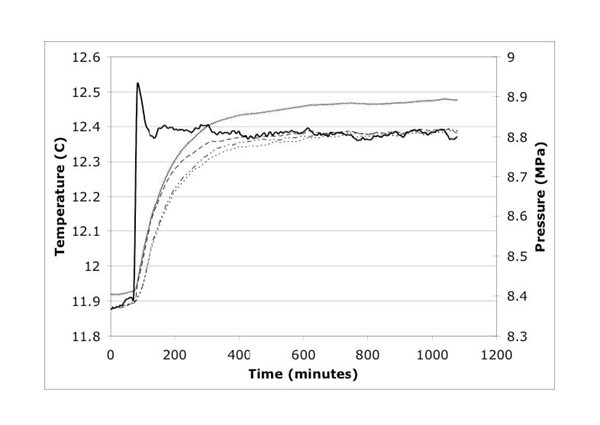
Figure 2. Thermally induced dissociation step. Temperature in the bath (solid black), at the vessel/sample interface (large dash), half radius (mixed long and short dashes), center (small dash), and pressure (gray) recorded in thermal dissociation of 10 cm diameter, 11 cm long sand/hydrate sample.