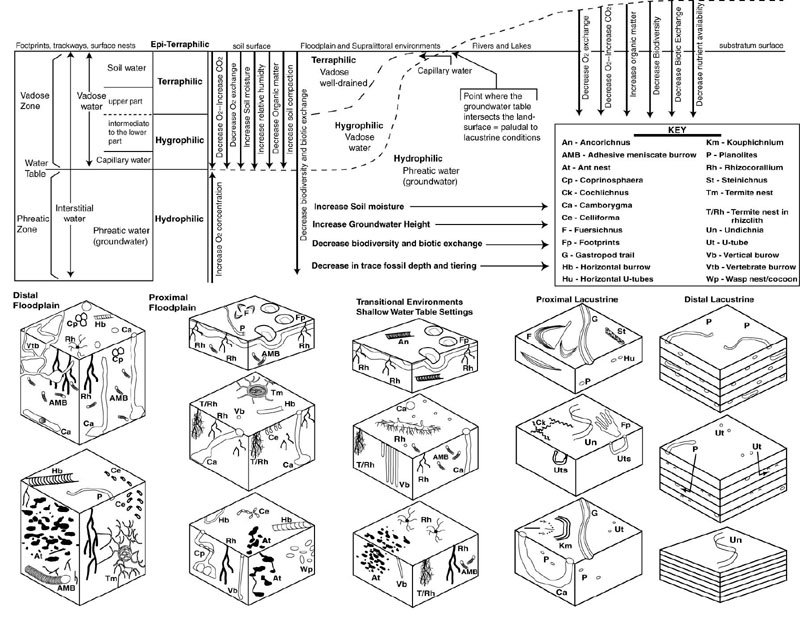
Figure 1. Schematic diagram illustrating the relationship between the geoshpere, atmosphere, hydrosphere, and biosphere, expressed by lateral variability in bioturbation, soil maturity, groundwater profile, and soil gases in terrestrial to aquatic environments.