Illustrations
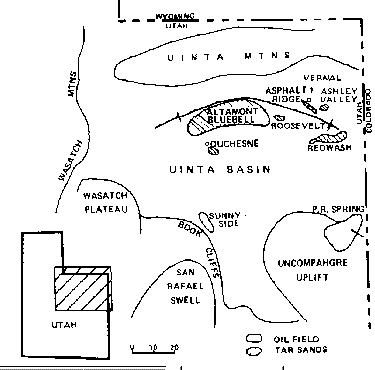
Figure 1. Index map of
the Uinta basin showing major fields.
From Lucas and Drexler, 1976.
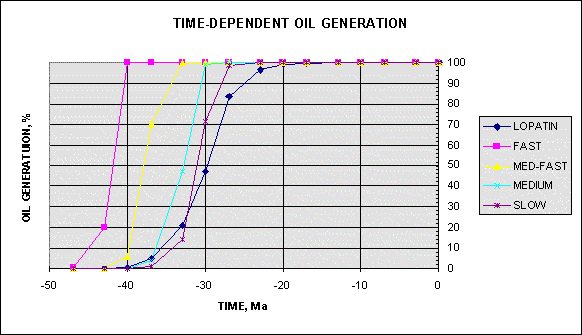
Figure 3. Oil generation
curves for the Shell 1-11B4
Brotherson well, Altamont-Bluebell field, Unita basin,
Utah. Derived form the Eocene burial history curve of Figure 5.
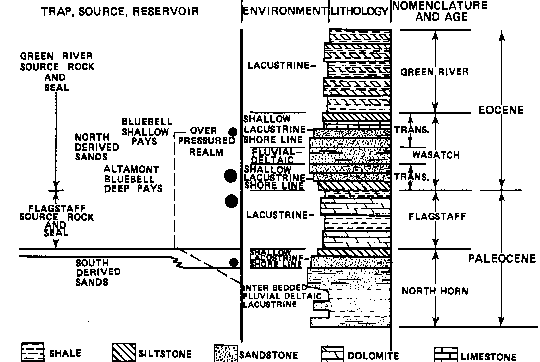
Figure 4. Reservoirs,
source, and seals, northern Uinta basin,
Utah. Major and minor oil and gas plays shown by large and
small dots. From Lucas and Drexler, 1976.
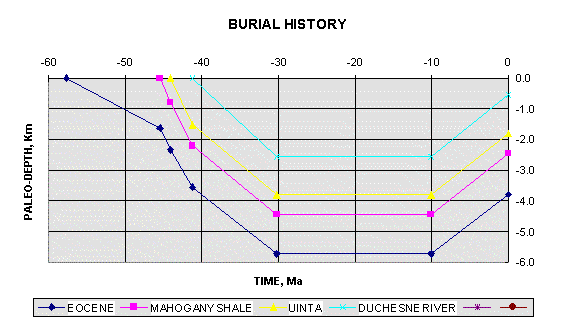
Figure 5. Burial history
curves, Shell 1-11B4 Brotherson well.
Derived from a scanned image of Figure 11 of Sweeney et al
(1987).