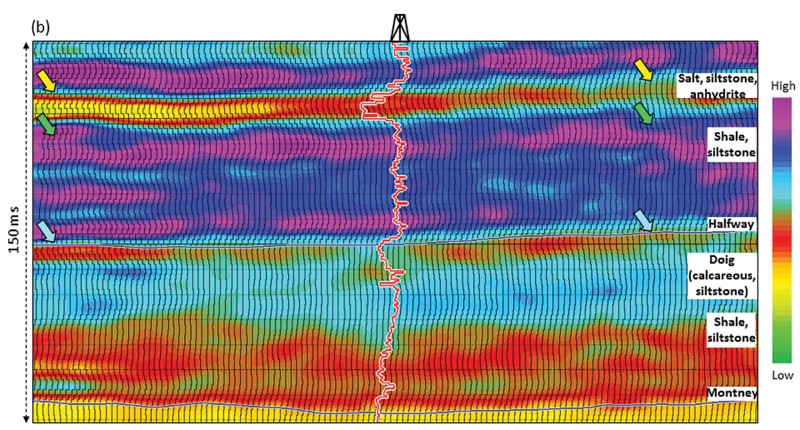
Figure 3b. A portion of a section from P-impedance volume computed using model-based (a) independent inversion, and (b) simultaneous inversion. The yellow, green and light blue arrows indicate the impedance zones (from left to right) that appear much better defined on the simultaneous inversion display in (b) than the independent model-based inversion display in (a).