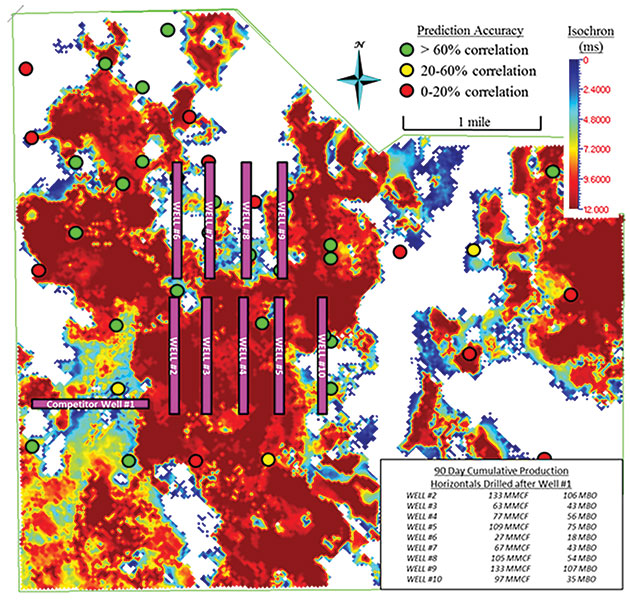
Figure 5. An isochron map of the predicted sand trend. Locations of vertical wells are shown color coded by prediction accuracy. Horizontal well activity is also shown with their accompanying 90-day cumulative production.
Figure 5. An isochron map of the predicted sand trend. Locations of vertical wells are shown color coded by prediction accuracy. Horizontal well activity is also shown with their accompanying 90-day cumulative production.