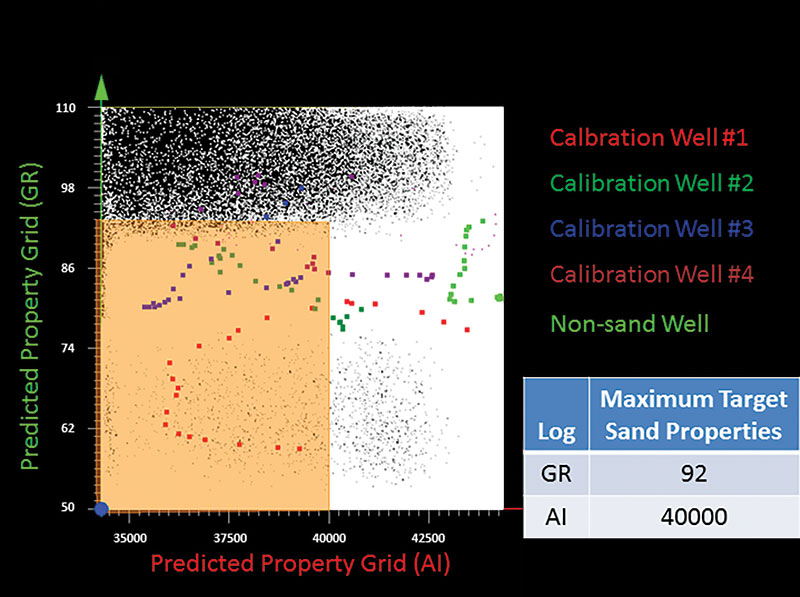
Figure 4. Cross-plot of the predicted property grids with sand values of calibration wells and a non-sand well plotted in color. White dots represent every strata-grid cell value (reservoir and non-reservoir) within the interval throughout the 14 sq. mi. study area. The upper range values of the reservoir were estimated from upscaled logs of calibration wells and served as the limits for the shaded polygon. The polygon was used to generate the final porous sand prediction map.