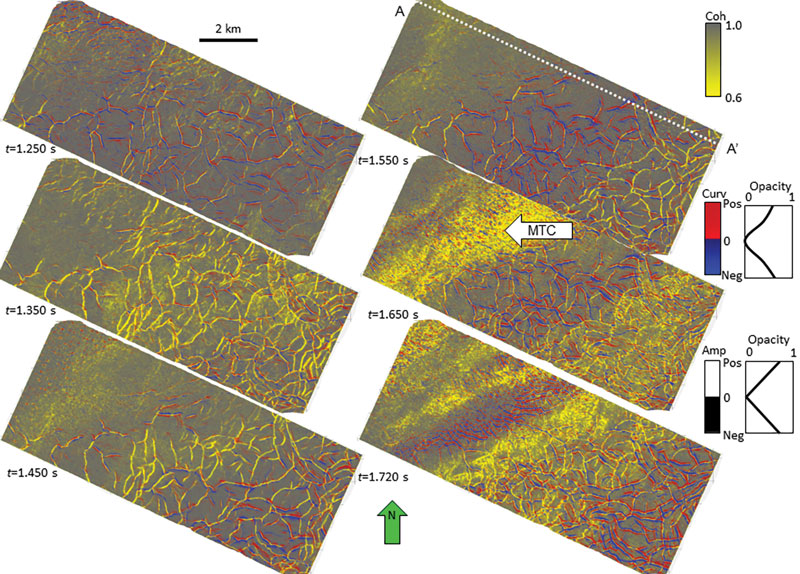
Figure 2. Time slice at approximately equal intervals through coherence, co-rendered with most-positive and most-negative principal curvatures, k1 and k2. Note how the appearance of the polygonal faults changes as we cut through different lithologies. At t=1.350 s, the faults are best delineated using coherence, while at t=1.550 s they are better delineated by curvature in the central part of the survey. We hypothesize – but without well control, do not at present know – that this variation is a function of the lithology, with faults through brittle rocks being seen better on coherence and more ductile rocks on curvature.