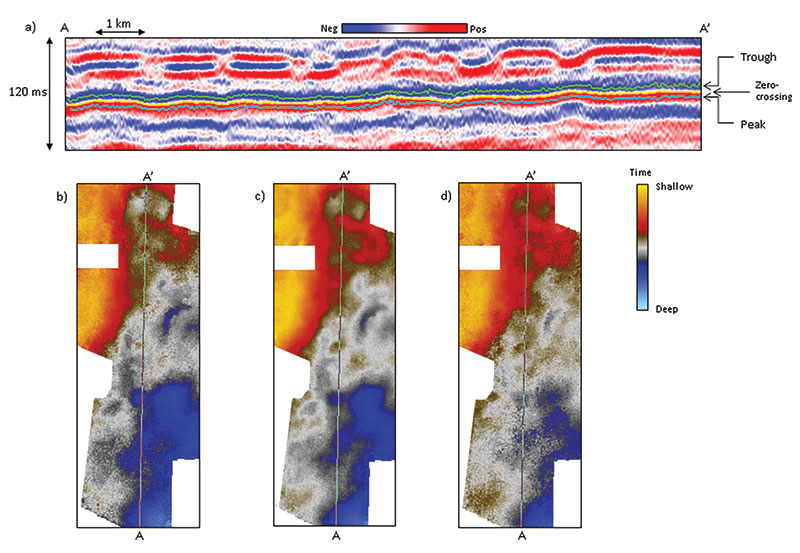
Figure 1. (a) Vertical slice AA’ through seismic amplitude showing three alternative horizon picks corresponding to autotracked troughs, zero-crossings (going from trough to peak), and peaks. Note how the yellow zero-crossing horizon pick is smoother. Corresponding time-structure maps computed from picks of (b) peaks, (c) zero-crossings, and (d) troughs. Note that (c) is less contaminated by noise. Data courtesy of Arcis Seismic Solutions, TGS.