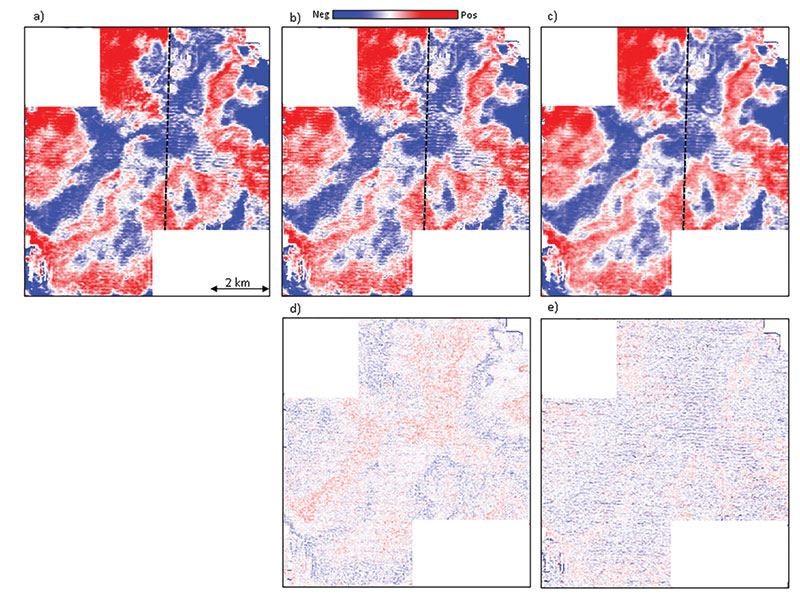
Figure 7. Time slice at t=1044 ms through seismic amplitude volumes (a) before, (b) after principal component structure-oriented filtering, and (c) after 3-point median filtering. Notice the background noise is better suppressed by the median filtering than by the principal component structure-oriented filter. However, while the E-W acquisition pattern seen seems to be toned down a bit after filtering, it is not eliminated completely. The black dashed line shows the location of the crossline segments. The difference displays between (a) and (b) and (a) and (c) are shown in (d) and (e) respectively. (Data courtesy of Arcis Seismic Solutions, TGS)