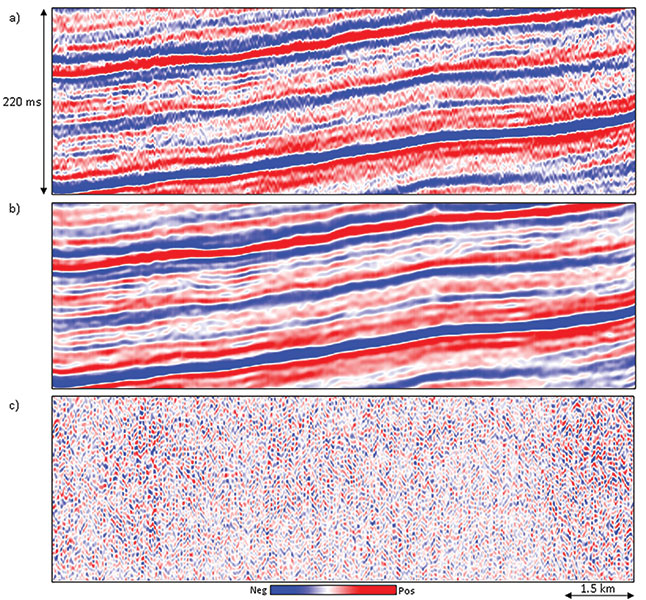
Figure 1. Vertical slice through seismic amplitude volumes (a) before, and (b) after principal component structure-oriented filtering, and (c) the difference section. Notice the broken inclined wave trains of noise are seen in the difference section and the display after structure-oriented filtering looks clean with the reflections much more coherent. (Data courtesy of Arcis Seismic Solutions, TGS)