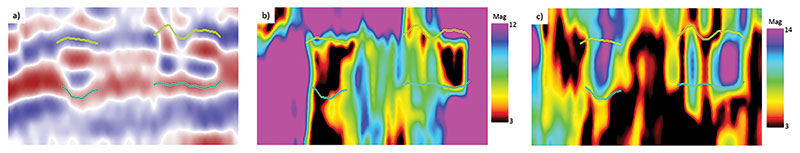
Figure 2. Panel (a) shows the same vertical slice of seismic data shown in Figure 1b with an interpretation of the channels based upon a top peak and a bottom trough. Panels (b) and (c) show the 30 and 50 Hz spectral components, respectively. Note that the channels are generally well interpretable in the spectral components, though some ambiguity exists in various cases.