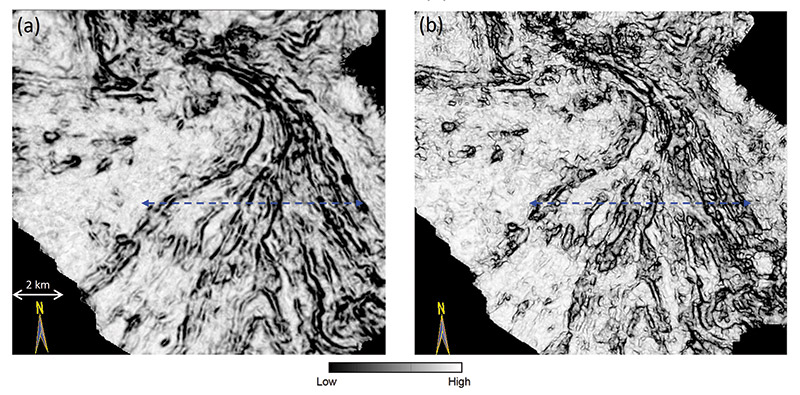
Figure 3. Phantom horizon slices 20 ms below the green horizon shown in Figure 2 through coherence volumes generated from 5-D interpolated data at (a) nominal 20 m by 20 m, and (b) finer 10 m by 10 m bin size. Blue line corresponds to vertical slice shown in Figure 2. Notice the crisp definition of the limbs of the distributary channel system.