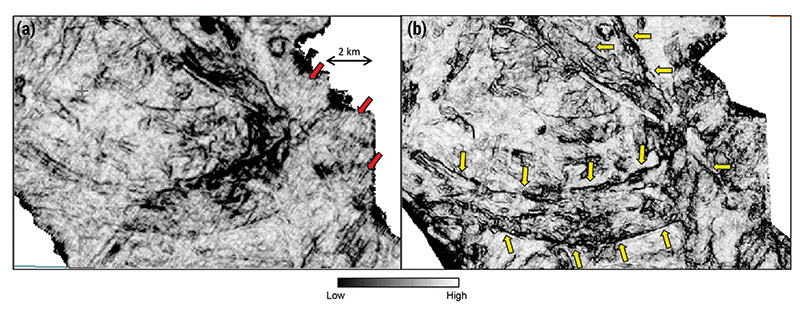
Figure 1. Stratal slices through coherence volumes close to a shallow marker horizon at t=600 ms generated from 5-D interpolated data at (a) nominal 20 m by 20 m, and (b) finer 10 m by 10 m bin size. Red arrows indicate a pervasive footprint. Yellow arrows indicate features at higher resolution.