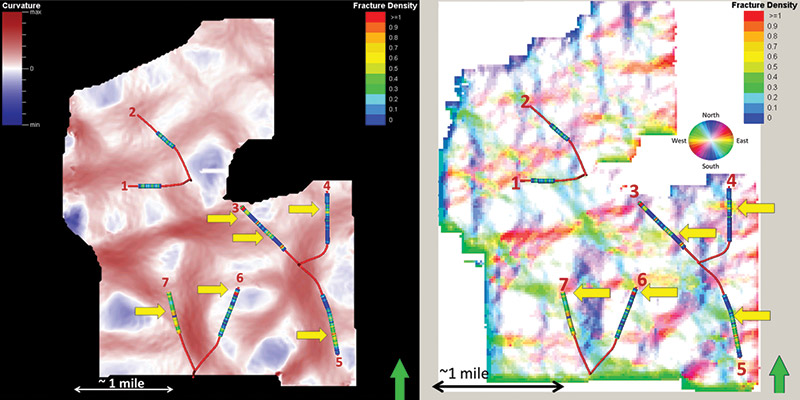
Figure 2. (Left) Interpreted top Hunton horizon co-rendered with most-positive curvature attribute and displaying the horizontal wells drilled into the Hunton horizon and colored by fracture density. (Right) Most-positive curvature attribute co-rendered on the top Hunton horizon and colored by most-positive curvature strike direction. Yellow arrows on both images show areas where most-positive curvature visually correlates to high fracture density along the wellbore.