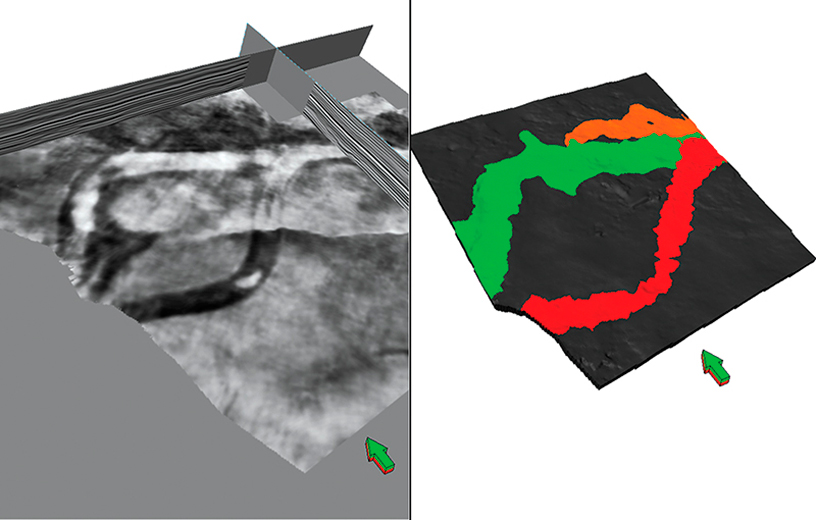
Figure 3. Chair diagram of the seismic data with a time slice at 1.8 s (a) and a 3-D view of the geo-cellular grid constructed from the combined well log and phase residues interpretation (b).
Figure 3. Chair diagram of the seismic data with a time slice at 1.8 s (a) and a 3-D view of the geo-cellular grid constructed from the combined well log and phase residues interpretation (b).