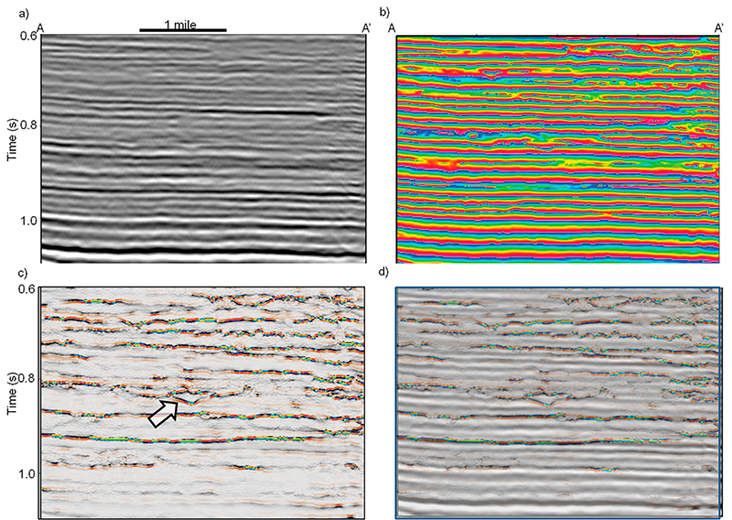
Figure 3. Vertical slices along line AA’ shown in the previous image through (a) the seismic amplitude, (b) the instantaneous phase, (c) the phase residue, and (d) the co-rendered phase residue and seismic amplitude volumes. The instantaneous phase is plotted using a cyclical color bar. The phase residues are color coded by the magnitude and frequency of the spectral components at which they occur.