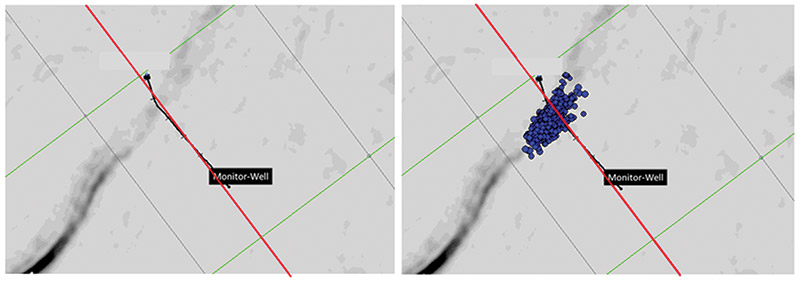
Figure 3. Similarity horizon slice extracted along the stimulated zone of interest monitored for microseismic activity. (The original seismic data used as input into the similarity algorithm is the property of Seitel Inc.) Highly similar data is colored in grey shades while areas with low similarity values are tinted black. Microseismic events from the hydraulic stimulation stage believed to have reactivated a fault are aligned very well with a similarity anomaly that also represents a fault system trace. The treatment well is shown for reference purposes. The red line labeled A-A' represents the direction and length of the line shown in Figure 2.