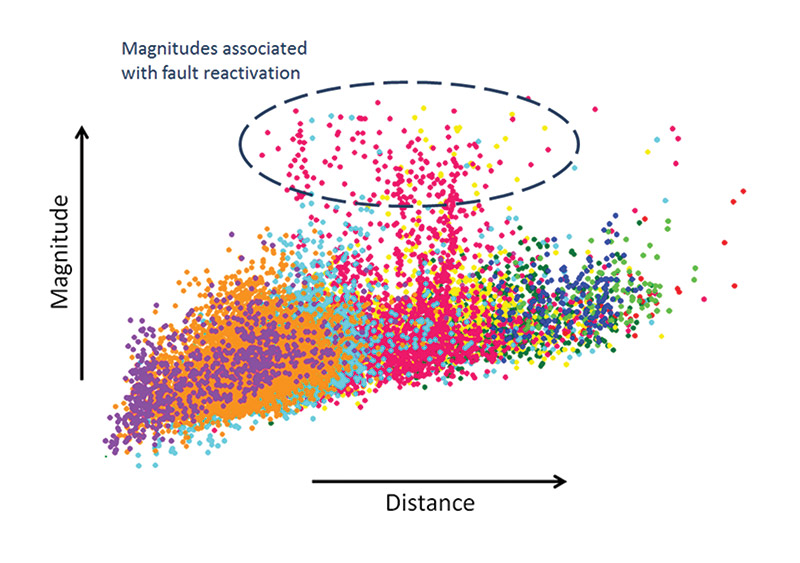
Figure 1. Magnitude vs. distance plot from a multi-stage hydraulic stimulation job monitored from a borehole for microseismic activity. Different colors represent event sets from different stages. Most of the stages generate microseismic events that predictably populate the graph (i.e. lower magnitude events can be detected near to the monitor well, while farther away from the monitor well only relatively higher magnitude events can be detected). Stages yellow, cyan, and especially red suggest fault reactivation due to their higher magnitude, as compared to magnitudes from other stages. Magnitude and distance increase respectively in the direction of the arrows.