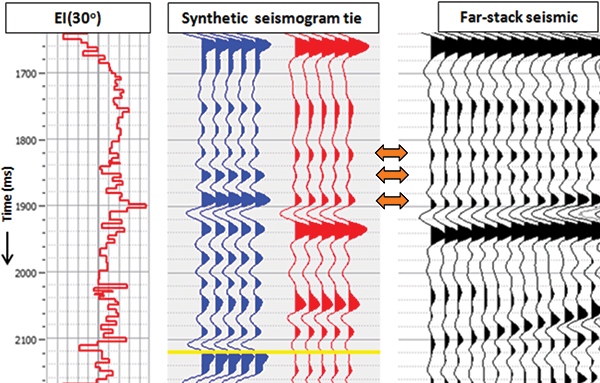
Figure 3. Synthetic seismogram tie for the high-angle (~30°) far-stack. The synthetic seismogram was generated by using the computed EI (30°) log curve. The correlation seems to be reasonably good. Notice the weakening of the amplitudes at the location of the orange arrows. (Data courtesy: PetroNorte, Colombia).