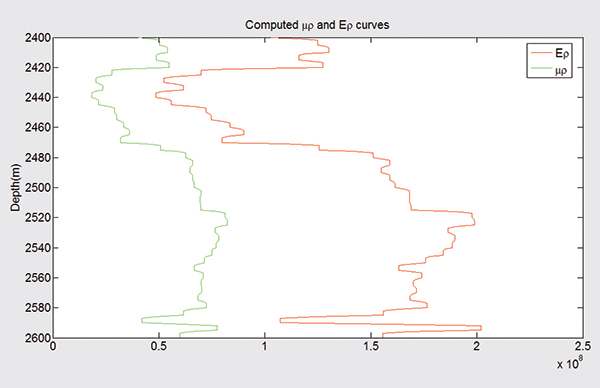
Figure 2. μρ and Eρ curves computed from segmented input logs for the same well. More emphasized lithologic variation is seen on the Eρ curve (right, red) than on the μρ curve (left, green).
Figure 2. μρ and Eρ curves computed from segmented input logs for the same well. More emphasized lithologic variation is seen on the Eρ curve (right, red) than on the μρ curve (left, green).