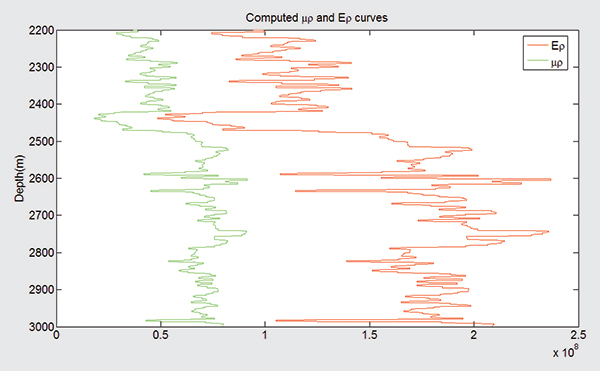
Figure 1. Computed μρ curve (left, green) plotted against the Eρ curve (right, red). Notice, the Eρ curve shows more emphasized lithologic variation than the μρ curve.
Figure 1. Computed μρ curve (left, green) plotted against the Eρ curve (right, red). Notice, the Eρ curve shows more emphasized lithologic variation than the μρ curve.