![]() Click to view article in PDF format.
Click to view article in PDF format.
GCP-Wave Wipeout Zones Caused by Low Gas Saturation Strata*
Bob Hardage1
Search and Discovery Article #40923 (2012)
Posted May 7, 2012
*Adapted from the Geophysical Corner column, prepared by the author, in AAPG Explorer, April, 2012, and entitled "Wipeout Zones –Blame the Rocks". Editor of Geophysical Corner is Satinder Chopra ([email protected]). Managing Editor of AAPG Explorer is Vern Stefanic; Larry Nation is Communications Director. AAPG©2012
1 Bureau of Economic Geology, The University of Texas at Austin ([email protected])
A hydrocarbon exploration application that has caused multicomponent seismic data to be acquired across several offshore areas is the ability of S-wave modes to image geology inside broad, thick intervals of gas-charged sediment where P-P seismic data show no usable reflections. The term “P-wave wipeout zone” is often used to describe this imaging problem.
|
|
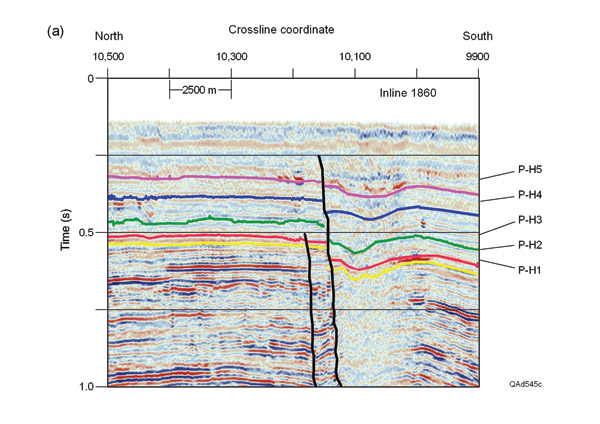
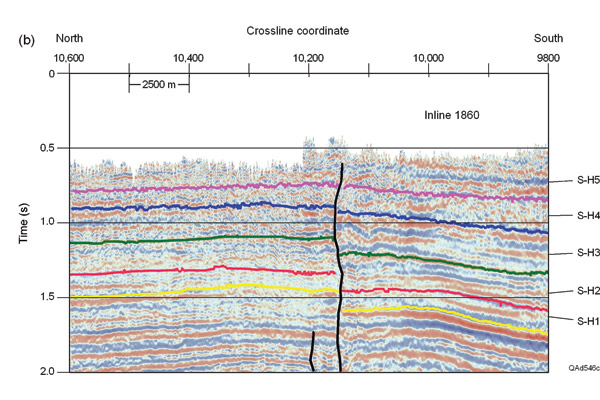
An example of P-P and converted-shear (P-SV) imaging across an area of shallow, gas-charged sediments of the Gulf of Mexico is displayed as Figure 1. Visual inspection of these images shows the P-P mode provides poor, limited information about geological structure, depositional sequences and sedimentary facies inside the image space dominated by gas-charged sediment (CDP coordinates 10,000 to 10,150). Conventional seismic stratigraphy (P-P mode only) would have little success in analyzing geological conditions within this poor-quality P-P image area. In contrast, the P-SV mode (Figure 1b) provides an image that is sufficient for structural mapping, as well as for analyzing seismic sequences and seismic facies. Both of these interpretation options are obvious advantages of elastic wavefield stratigraphy over conventional seismic stratigraphy in areas having gas-charged sediment. A simple Earth model consisting of a shale layer atop a sand layer can be used to evaluate P-P and P-SV reflectivity behaviors associated with P-wave wipeout zones. Two pore-fluid situations are defined on table 1:
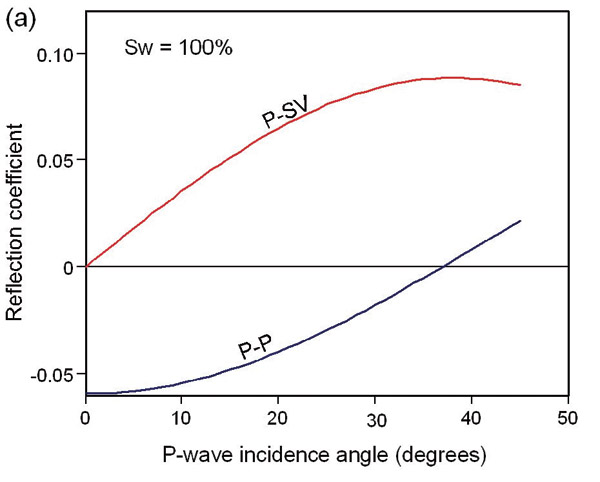
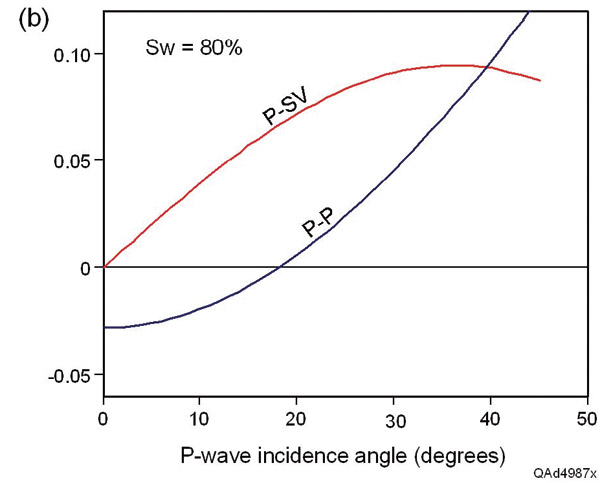
P-P and P-SV reflectivity curves for these two pore-fluid conditions are shown as Figure 2. When pore fluid is 100% brine, P-P and P-SV reflectivities have opposite algebraic signs but approximately the same average magnitude (about 5%) for incidence angles ranging from 0 to 25% (Panel a). When pore fluid changes to 20% gas (Panel b), P-SV reflectivity is unchanged, but P-P reflectivity decreases in magnitude and undergoes a phase reversal at an incident angle of approximately 18%. The gas-charged sediment, thus, does not affect P-SV imaging – but P-P imaging is seriously degraded. The negative reflectivity for incident angles between 0 and 18 degrees essentially cancel the positive reflectivities for incident angles greater than 18%, resulting in “wipeout” P-wave reflections. The effect would be similar to that exhibited by the data on Figure 1. There is logical rock physics evidence why P-wave wipeout zones occur in strata having low gas saturation and why S-mode data are insensitive to low gas saturation. |
 General statement