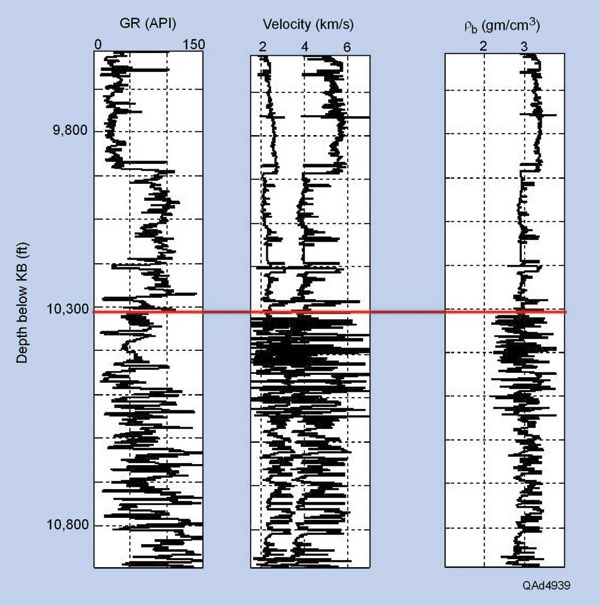
Figure 2. Log data across the Wolfcamp interval (9,714 to 10,902 feet KB). The velocity curve on the left of the center panel is shear velocity, VS. The curve on the right is compressional velocity VP. Wolfcamp reflectivity was evaluated at the interface drawn at approximately 10,300 feet (3,149 meters).