![]() Click to view presentation in PDF format.
Click to view presentation in PDF format.
Analyzing Spatial Patterns in Modern Carbonate Sand Bodies from Great Bahama Bank*
Paul (Mitch) Harris1, Samuel J. Purkis2, and James Ellis3
Search and Discovery Article #50419 (2011)
Posted May 31, 2011
*Adapted from oral presentation at AAPG Annual Convention and Exhibition, Houston, Texas, USA, April 10-13, 2011. Please refer to closely related article by Mitch Harris and co-workers, entitled “Enhancing Subsurface Reservoir Models – An Integrated MPS Approach Using Outcrop Analogs, Modern Analogs, and Forward Stratigraphic Models,.” Search and Discovery Article #50418 (2011).
1Chevron Energy Technology Company, San Ramon, CA ([email protected])
2National Coral Reef Institute, Nova Southeastern University, Dania Beach, FL
3Ellis GeoSpatial, Walnut Creek, CA
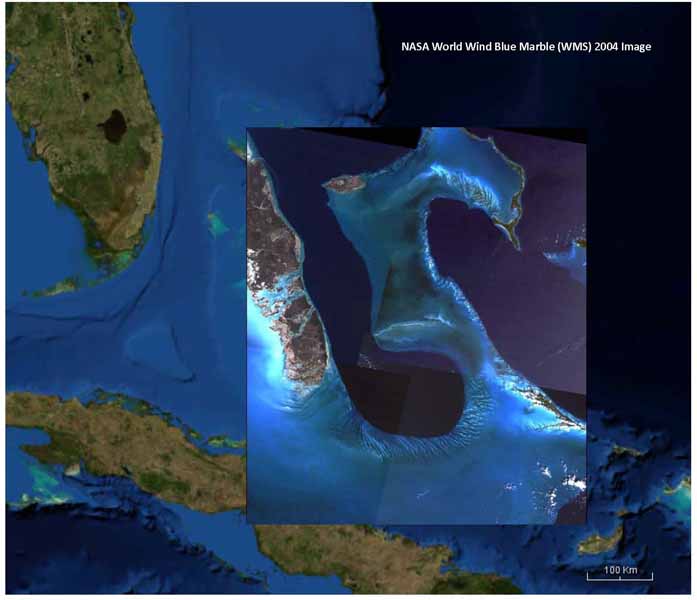
Three carbonate sand bodies on Great Bahama Bank which show a range of depositional facies patterns are quantitatively interrogated to broaden our perspective of the types of information that can be derived from studies of modern environments. Rimming the southern end of Tongue of the Ocean (TOTO) is the broadest expanse of “high-energy” sands found in the Bahamas characterized by narrow sandbars separated by wide, deep channels and a lack of islands. A variation of the tidal bar motif with broader and more irregular sandbars, relatively narrow channels, and few small islands occurs at the northern end of Exuma Sound (Schooners). Further. sands associated with tidal channels and the numerous islands of the Exumas chain along the western edge of Exuma Sound occur primarily as flood tidal deltas.
The geometry of sandbars that inhabit the three sand bodies is quantified using Landsat remote sensing and assembled, along with optically-derived bathymetric surfaces, into a GIS. This database is quantitatively examined using a suite of morphometric tools to compare and contrast geometric character of sandbars within and between the three sand bodies. Considered are properties such as the size, shape, complexity, distribution, orientation, and topography of the individual sandbars. Profiles and spatial analysis tools enable sandbar and channel spacing, position relative to the platform margin, connectedness, separation distances, and density to be characterized. As has been previously reported for reef-dominated environments, certain aspects of the geometry of the three sand bodies are found to behave in a systematic and hence predictable manner. Because the three sand bodies are disparate in their overall extent and depositional settings (e.g., orientation, prevalence of islands), this predictable behavior has the potential to impart considerable insight to the characterization of grainstone systems.
|
|
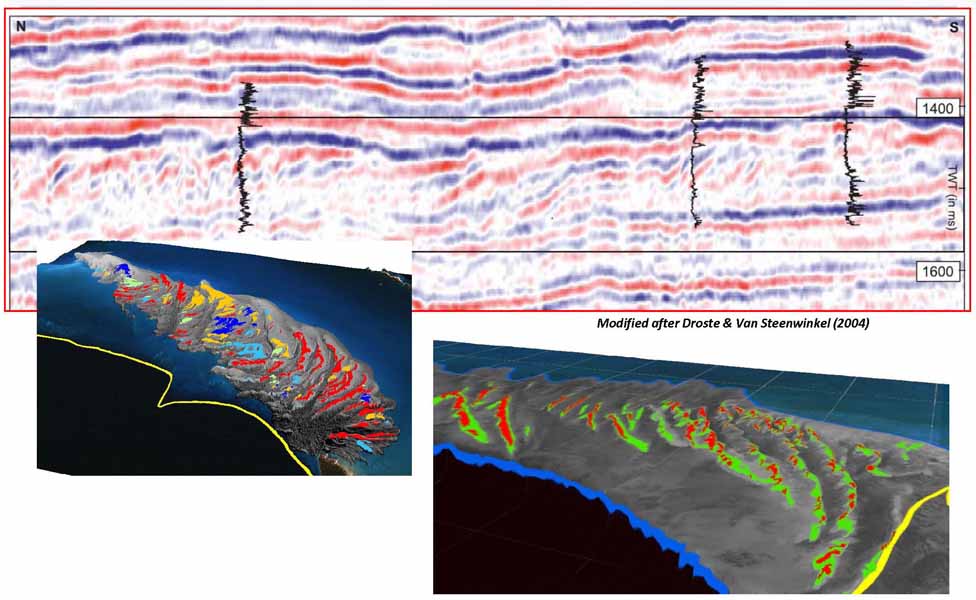
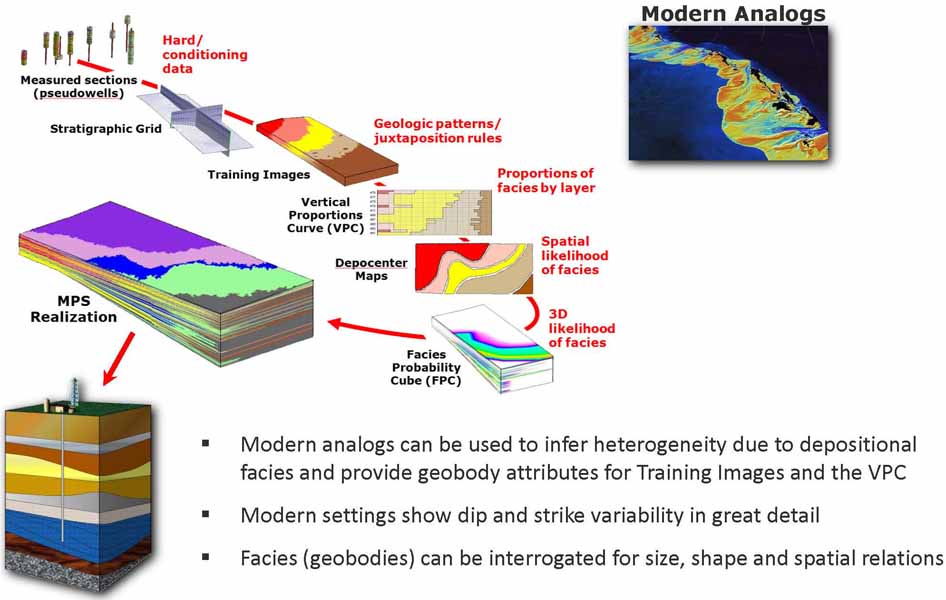
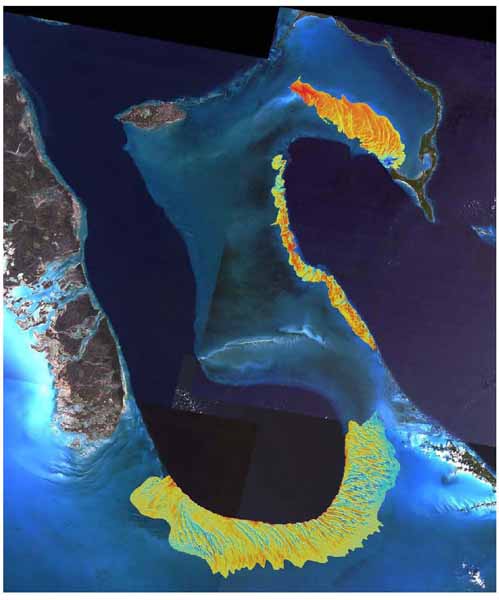
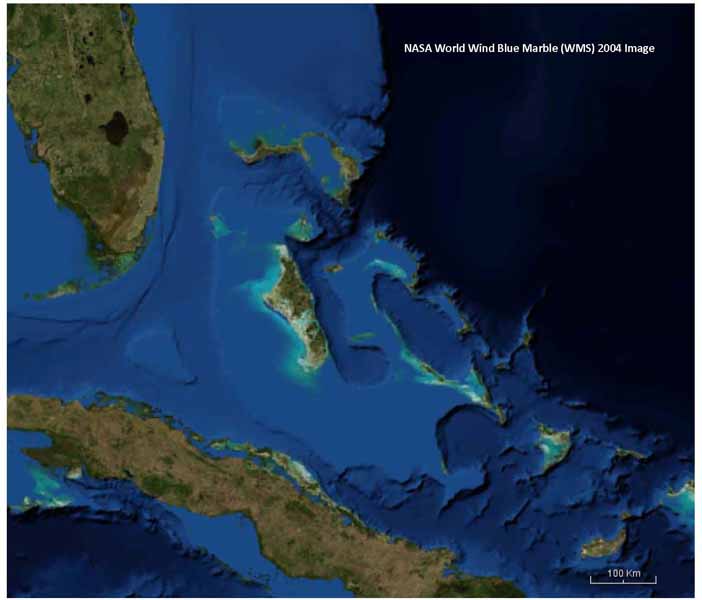
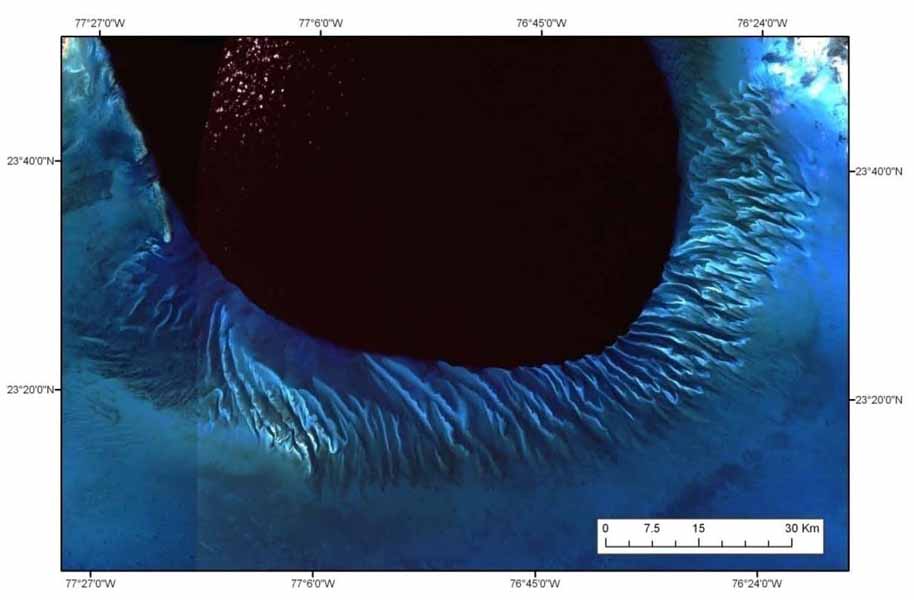
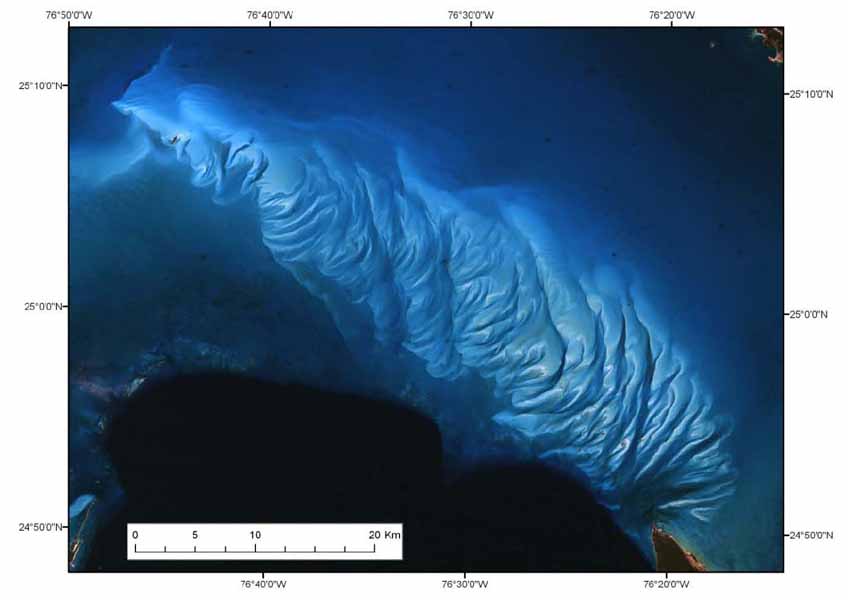
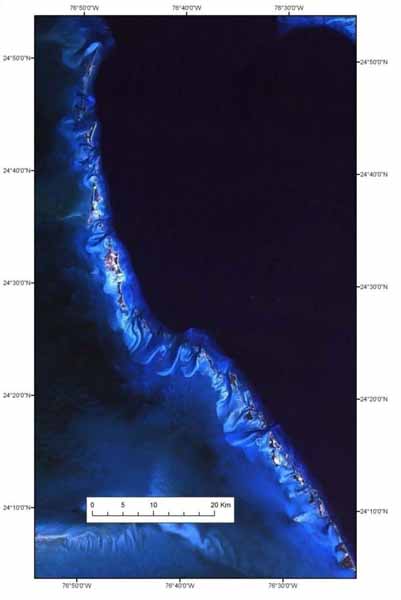
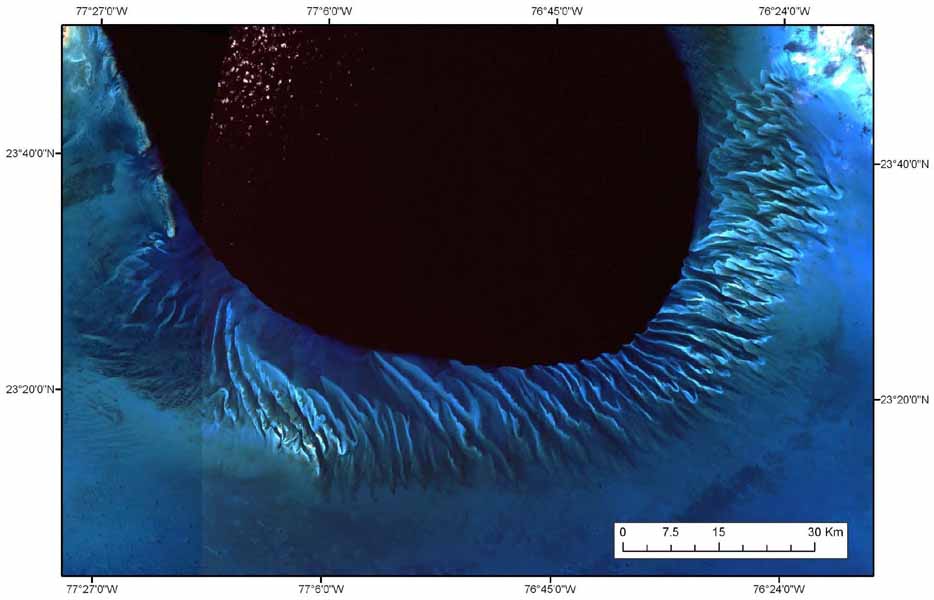
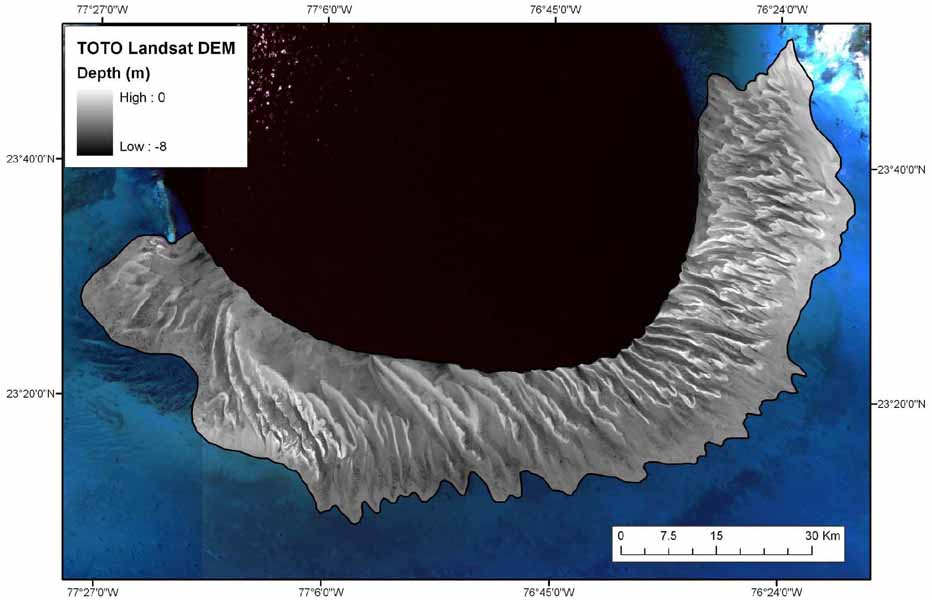
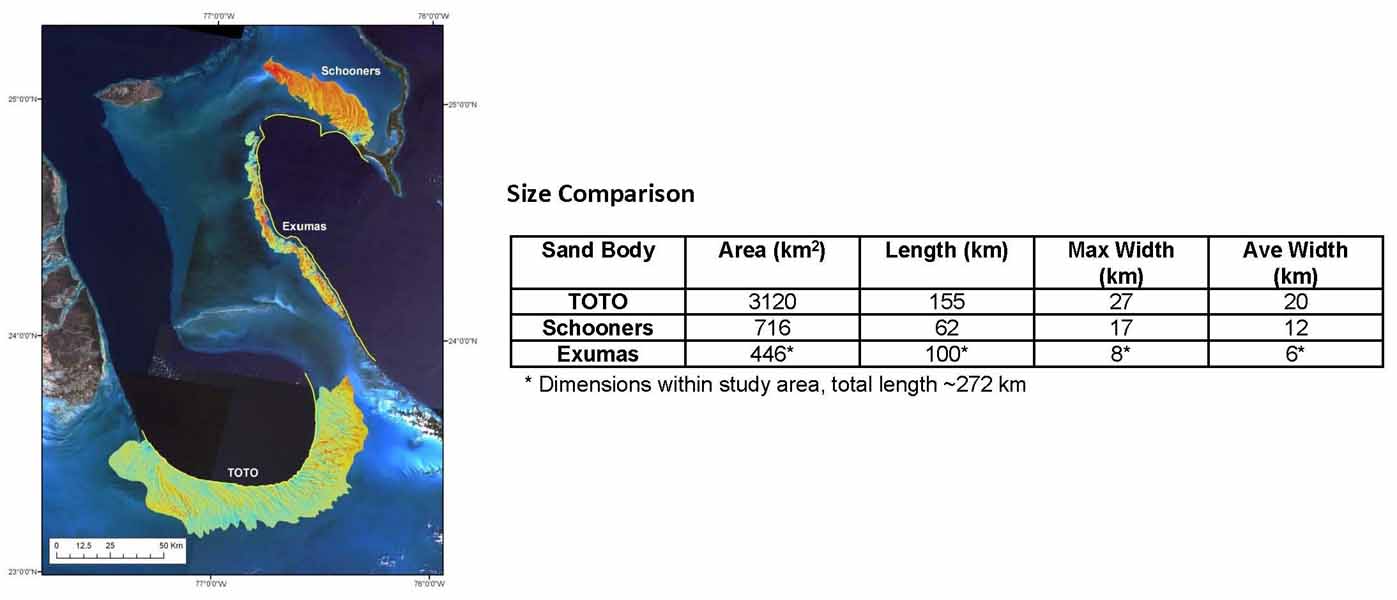
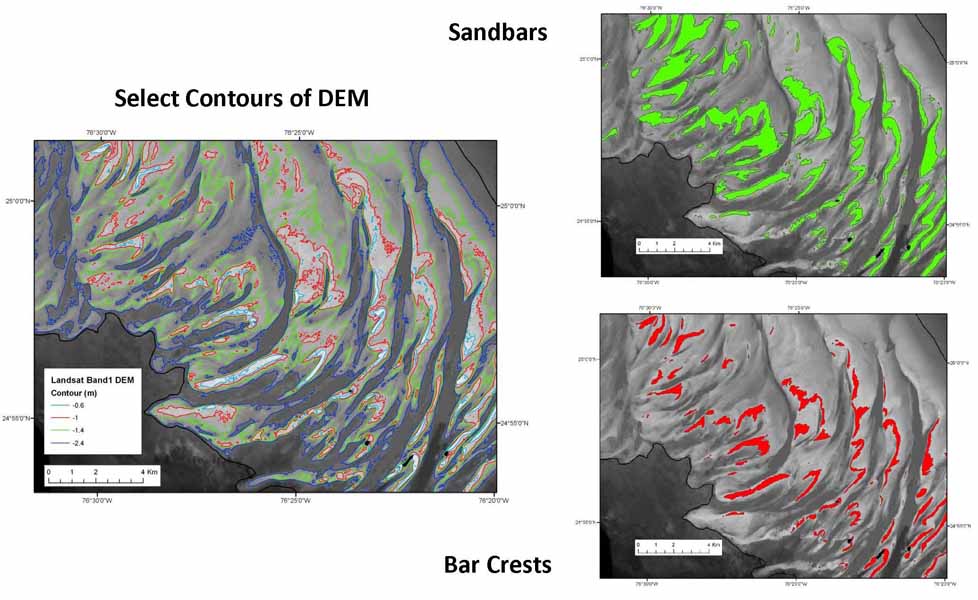
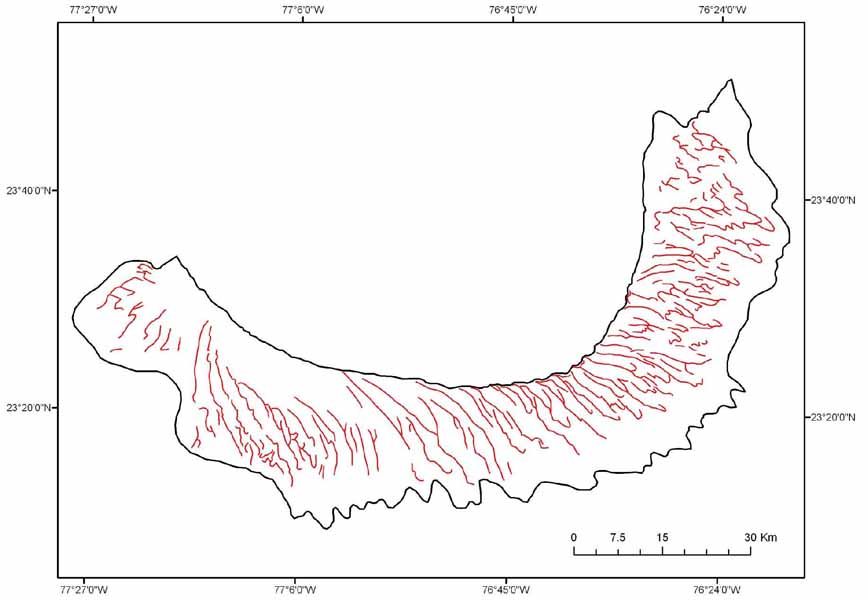
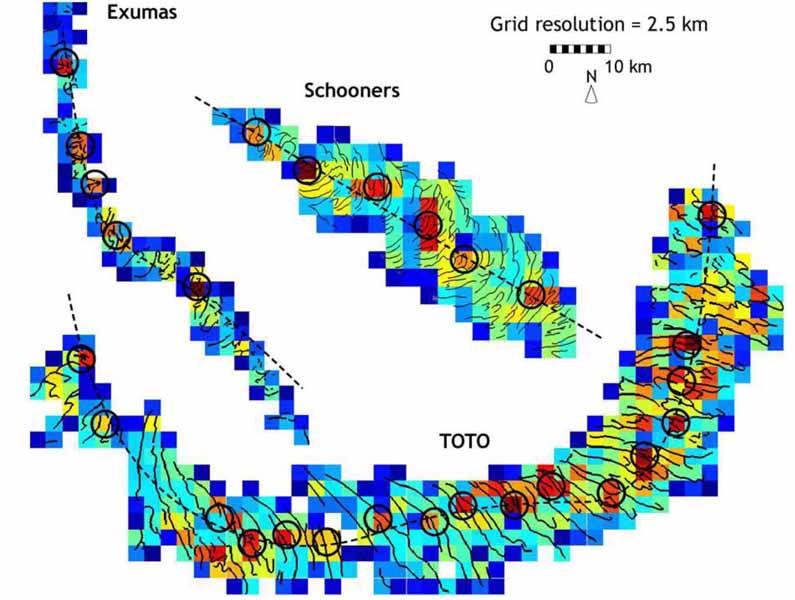
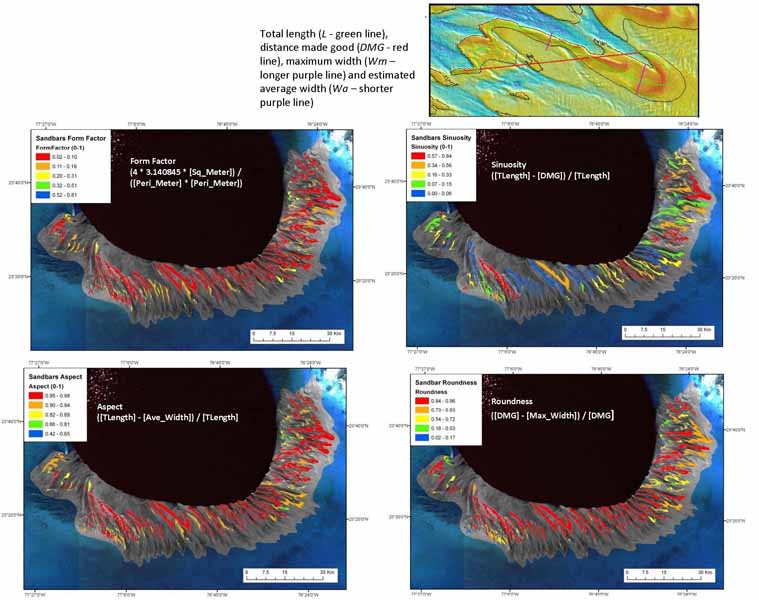
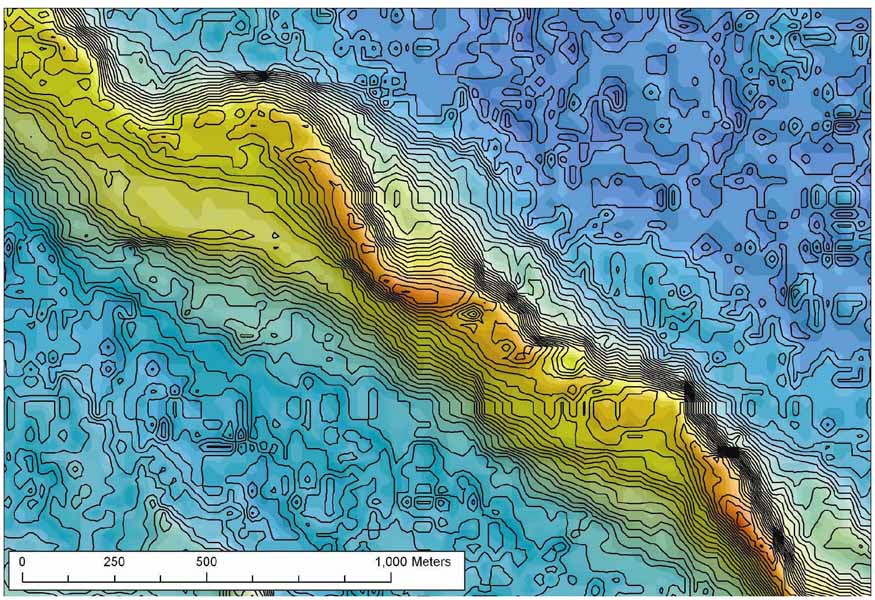
Modern analogs help refine suburface interpretations (Figure 1), and they provide data for reservoir characterization and modeling (Figure 2). They can be used to infer heterogeneity due to depositional facies and provide geobody attributes for Training Images and the Vertical Proportions Curve (VPC). Modern settings show dip and strike variability in great detail; facies (geobodies) can be interrogated for size, shape, and spatial relations. Study Area on Great Bahama Bank (Figures 3, 4, and 5) Tongue of the Ocean (Figure 6) Rimming the southern end of TOTO is the broadest expanse of “high-energy” sands found in the Bahamas, a sand body extending parallel to the platform edge for 155 km and covering 3120 km². This sand body is generally characterized by narrow sandbars separated by wide, deep channels and a lack of islands. Individual sandbars extend onto the shallow platform on average 20 km but up to 27 km. Schooners(Figure 7) A variation of the sandbar motif occurs at the northern end of Exuma Sound (Schooners), where a sand body covering 716 km² and extending along the platform edge for 62 km is progressively set back from the platform edge toward the west. In comparison to TOTO, it contains broader and more irregular sandbars up to 17 km long, averaging 12 km, with relatively narrow channels and few small islands. Exumas(Figure 8) Sands associated with tidal channels and islands of the Exumas along the western edge of Exuma Sound occur primarily as flood tidal deltas in a linear sand body set back from the platform edge. Lobes or sandbars extend up to 8 km, averaging 6 km, onto the platform and form a deposit extending 100 km along the platform edge and covering 450 km². The islands, often two or three paralleling each other, and the inter-island gaps (= channels) control the distribution of sand. Delineating the Sand Bodies and Sandbars Figure Captions (9-14)
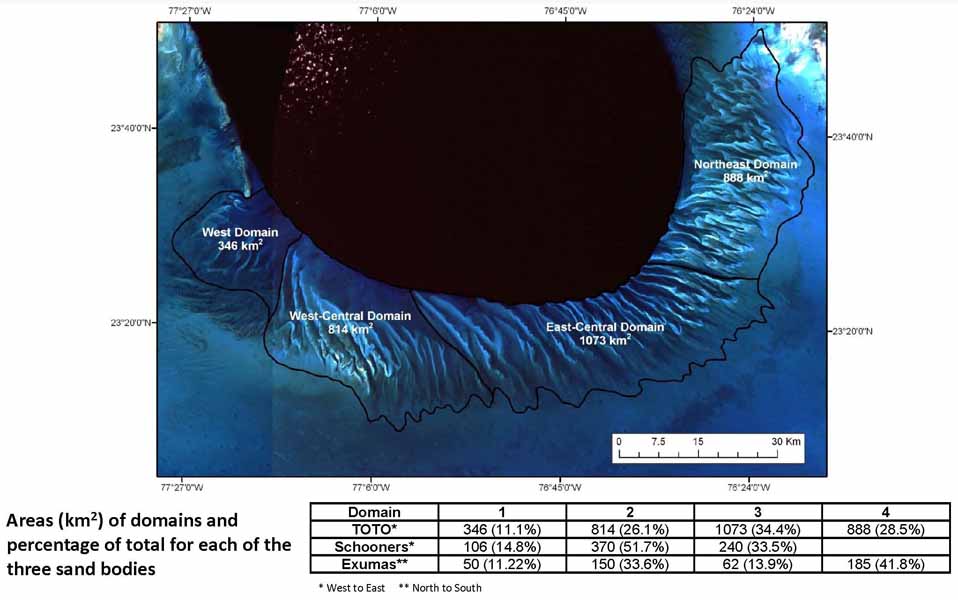
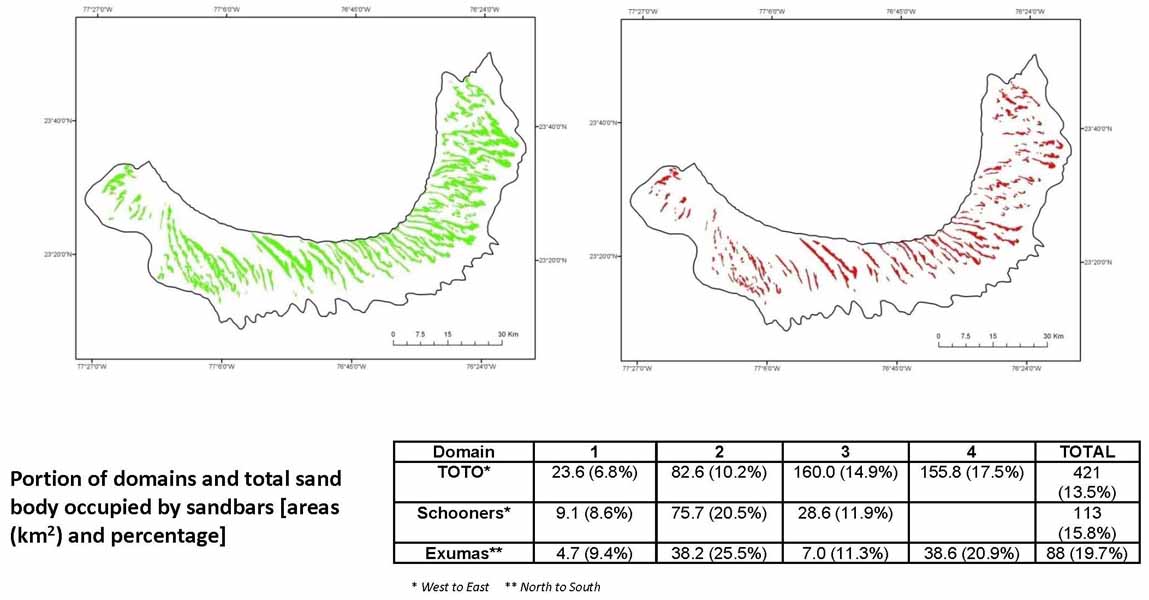
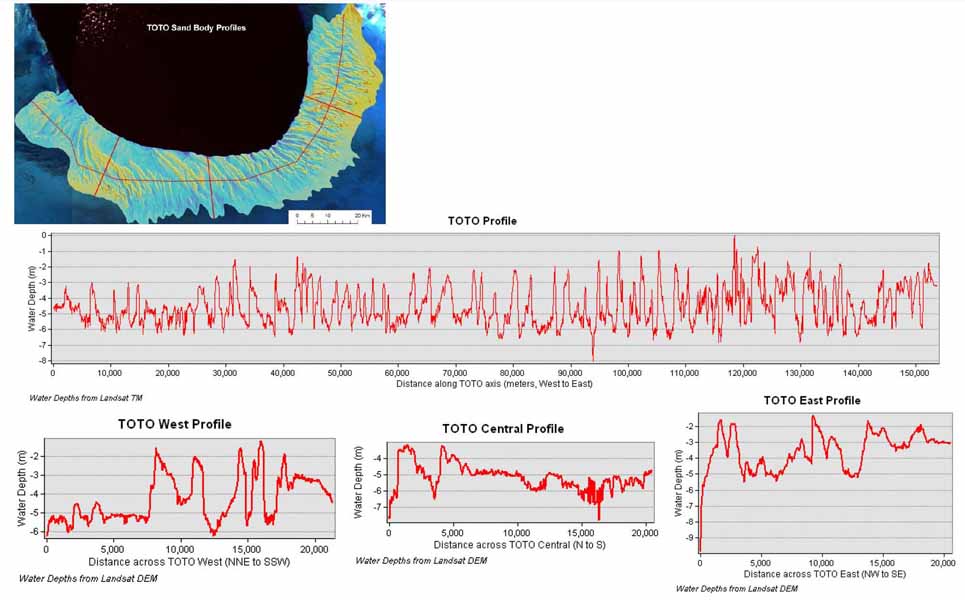
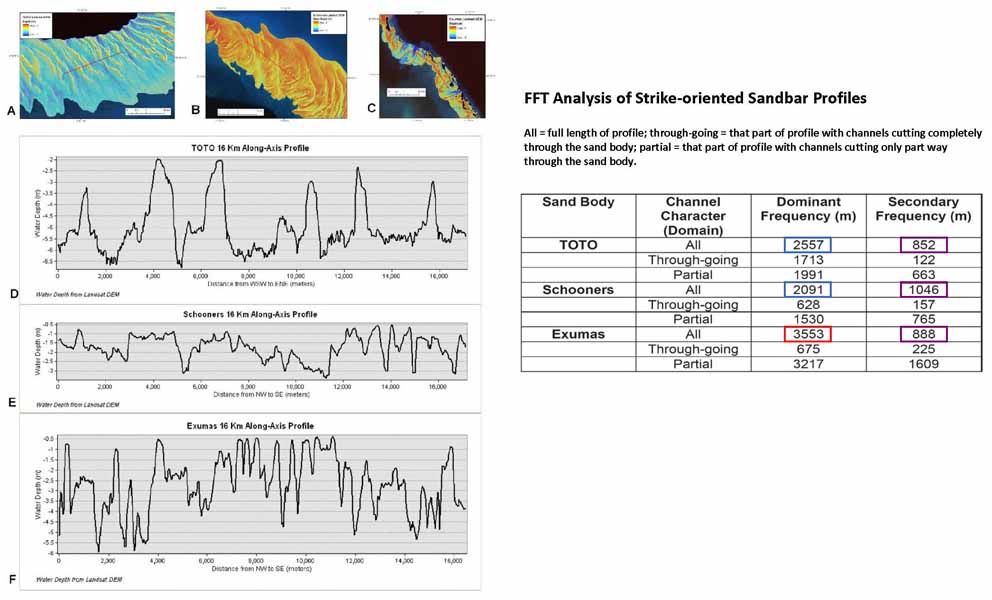
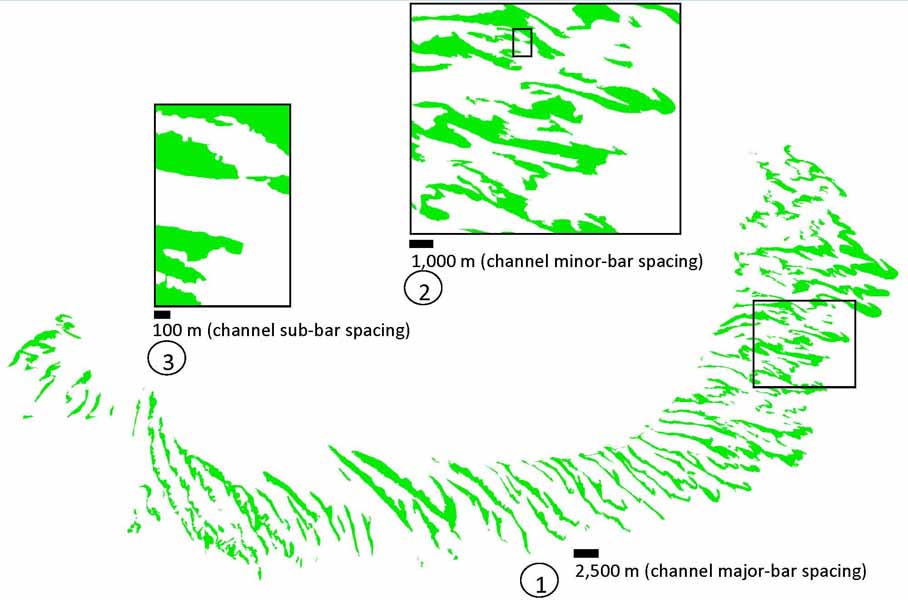
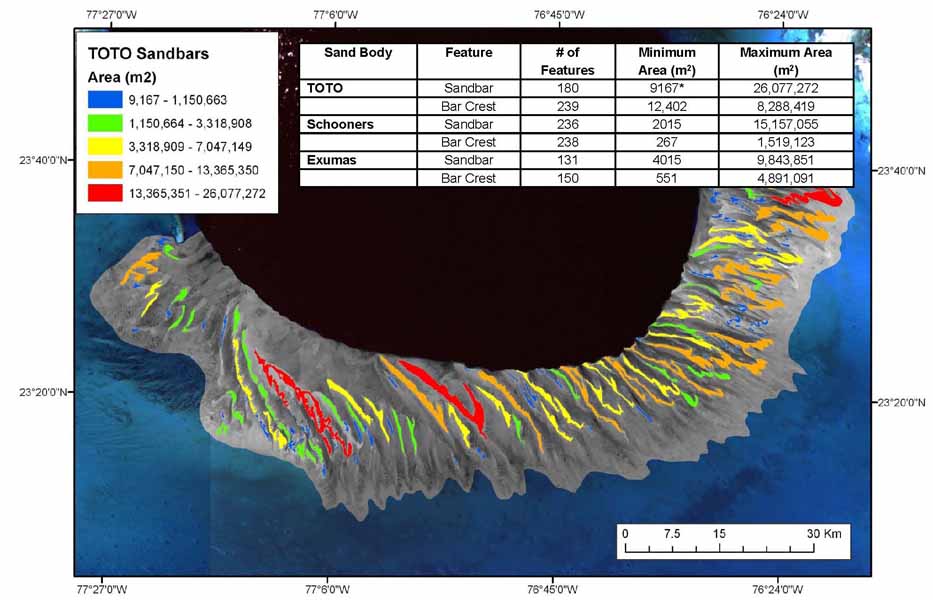
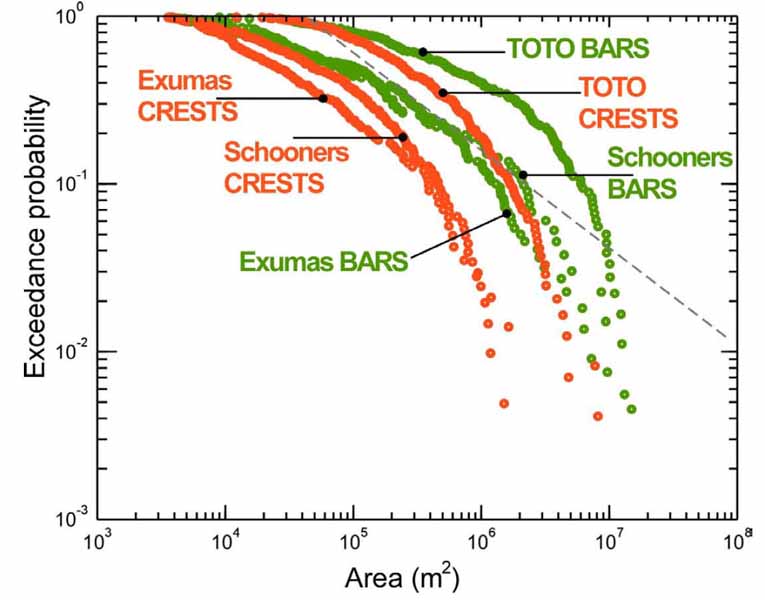
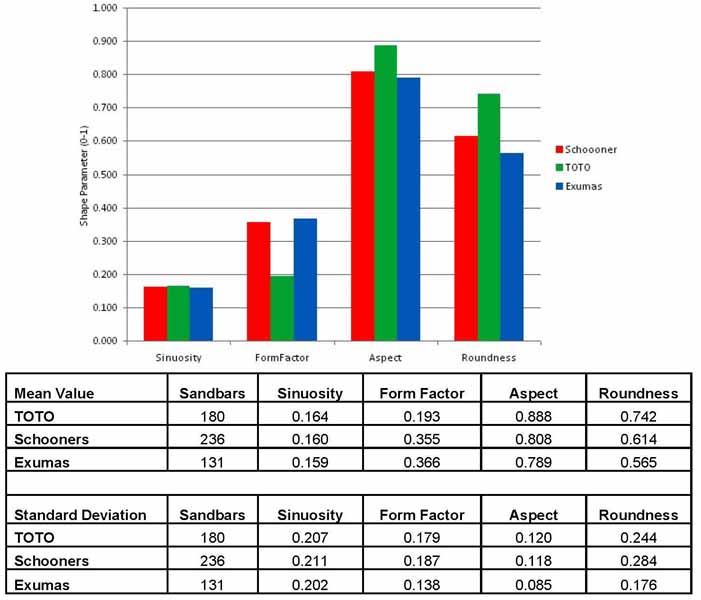
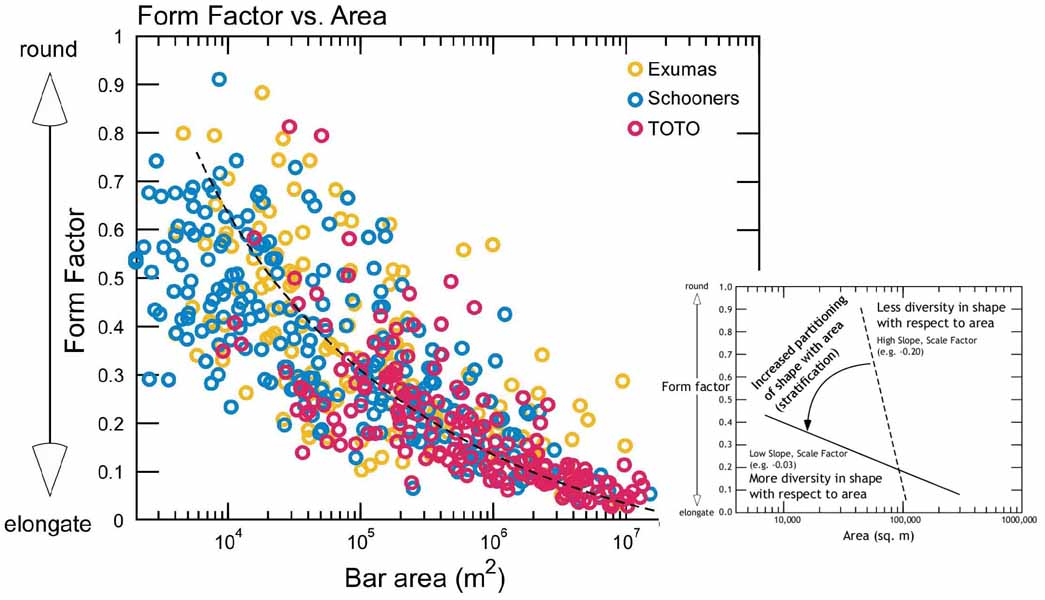
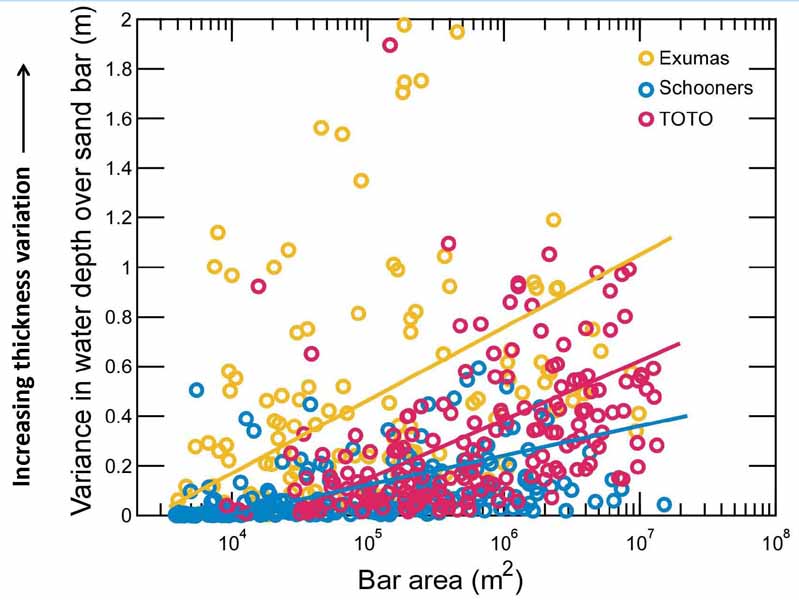
Tongue of the Ocean (Figures 9 and 10) Comparison of Sand Bodies (Figure 11) Collectively, the three sand bodies occur along an ~370-km belt paralleling the platform edge, and they show a range of depositional facies patterns found in modern deposits. Sand Body Domains (Figures 12, 13, and 14) Shown in the tabular data with the image of TOTO (Figure 12) are the area (in km²) of each domain and percentage of total for each. ortion of each domain and total sand body occupied by sandbars [areas (km²) and percentage]. Interrogating the Sand Bodies and Sandbars Figure Captions (15-27) Sand body Profiles of TOTO (Figure 15) llustrate that variable fill of accommodation space equals to heterogeneity and correlation challenges within a sand body. FFT analysis of strike-oriented sandbar profiles ((Figure 16) shows that the dominant frequency is conspicuously long in the Exumas, where the sandbars are more lobate and wider than for Schooners and TOTO. Secondary frequencies, which are similar between sites, are interpreted as the breadth of the channels that separate sandbars. Therefore, channel breadth is more consistent between the three sand bodies than the width of the sandbars themselves. Attributes of sandbars that are useful measures of sand-body geometry include:
In comparing size and bar crests:
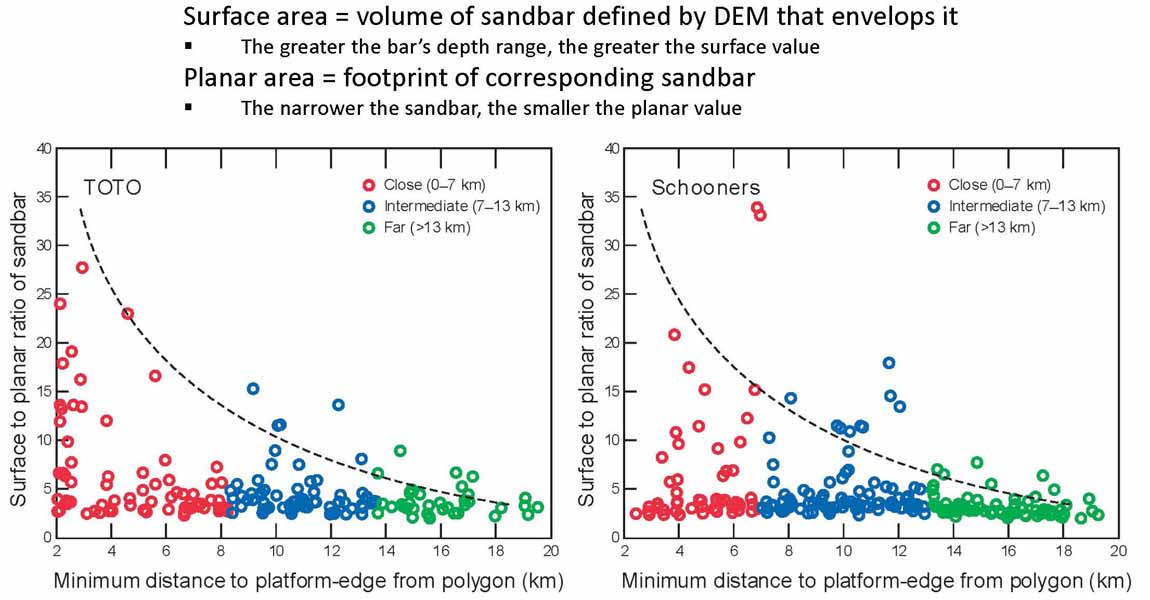
Three-Dimensional Form of Sandbars (Figures 25,26, and 27) Sandbars with highest S/P values are closest to the margin and, as visually apparent on the Landsat images and DEMs, their geometry is linear and elongated (Figure 27).
Droste, H.J., and M. Van Steenwinkel, 2004, Stratal geometries and patterns of platform carbonates: the Cretaceous of Oman, in G. Eberli, J.L. Massaferro, and J.F.R. Sarg (eds.) Seismic Imaging of Carbonate reservoirs and Systems, AAPG Memoir 81, p. 185-206.
Copyright © AAPG. Serial rights given by author. For all other rights contact author directly. |
 Abstract