![]() Click to view article in PDF format.
Click to view article in PDF format.
GCCurvature Computations Enhance Exploration*
Satinder Chopra1 and Kurt J. Marfurt2
Search and Discovery Article #40838 (2011)
Posted November 28, 2011
*Adapted from the Geophysical Corner column, prepared by the authors, in AAPG Explorer, November, 2011. Editor of Geophysical Corner is Bob A. Hardage ([email protected]). Managing Editor of AAPG Explorer is Vern Stefanic; Larry Nation is Communications Director.
1 Arcis Corp., Calgary, Canada ([email protected])
2 University of Oklahoma, Norman, Oklahoma
Curvature attributes have become popular with seismic interpreters and have found their way into most commercial seismic interpretation software packages. Curvature estimates were introduced as computations performed on interpreted 2-D seismic surfaces, and 3-D computations based on volumetric estimates of inline and crossline dip soon followed.
A 3-D volume of curvature values is produced by estimating reflector dip and azimuth at each data sample in a seismic volume. We denote the output of such calculations as structural curvature because the calculations are performed on time-based or depth-based seismic data that define the geometrical configurations of subsurface structure.
A second type of curvature attribute can be calculated by using seismic reflection amplitudes rather than geometrical shapes of structure. When an interpreter creates a 3-D horizon through a seismic amplitude volume, inline and crossline derivatives of amplitude-magnitude variations can be calculated across this horizon.
Attributes that define the gradient behavior of reflection amplitude in X-Y space across a horizon are called amplitude curvature and are valuable for delineating the edges of bright spots, channels and other stratigraphic features that produce lateral variations in reflection magnitudes.
|
|
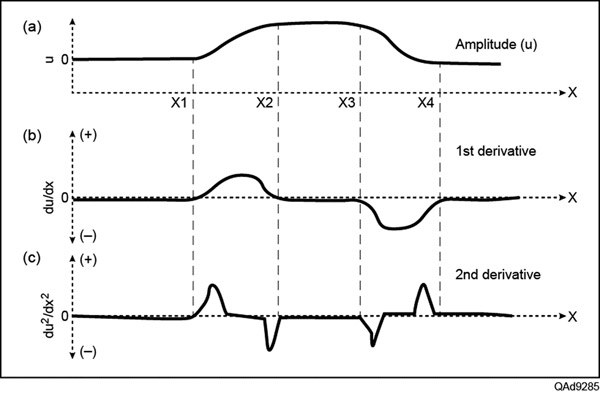
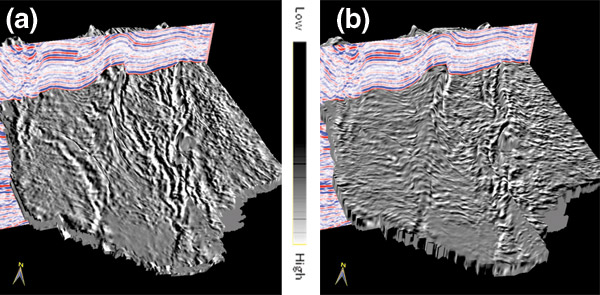
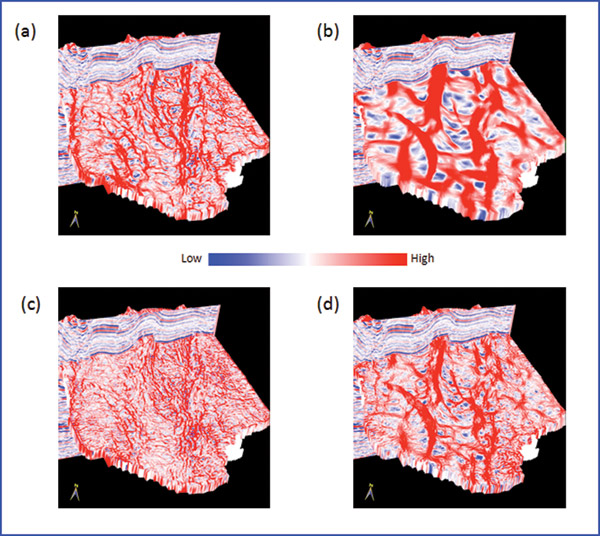
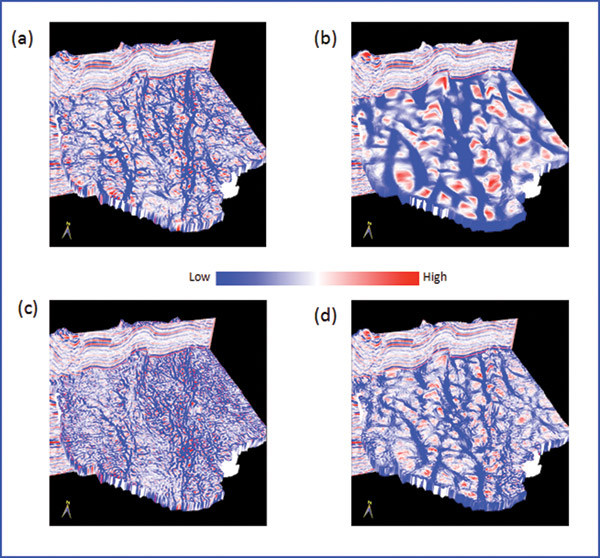
In Figure 1a we show a schematic diagram of the magnitude of a hypothetical seismic amplitude anomaly along image coordinate X. This curve shows an increase in reflection amplitude between image coordinates X1 and X4, with maximum amplitudes occurring between X2 and X3. Next, we compute the first and second spatial derivatives of this amplitude behavior with respect to X, and show the results in Figures 1b and 1c. Note how the extrema of the second derivative in Figure 1c define where the amplitude anomaly undergoes a change in magnitude. In a 3-D seismic volume, amplitude gradients are computed along structural dip by taking derivatives in inline and crossline directions. Figure 2 shows 3-D chair views of an inline vertical slice through a seismic amplitude volume and the correlation of that profile with energy-weighted amplitude gradients calculated in the inline direction (Figure 2a) and in the crossline direction (Figure 2b). Both images show independent views of north-south oriented main faults and features related to those faults. A geological structure has curvature of different spatial wavelengths at various locations across the structure. Thus structural curvature computed at different wavelengths provides different perspectives of the same geology. Short-wavelength curvature tends to delineate details showing intense, highly localized faulting. In contrast, long-wavelength curvature enhances subtle flexures on a scale of 100, 200 or more image traces that are difficult to see on conventional seismic data. These long-wavelength features often correlate to fault-generated patterns that are below seismic resolution, shallow bowl-shaped collapse features or modest dome-shaped carbonate buildups. Figure 3 and Figure 4 compare long-wavelength and short-wavelength computations of most-positive and most-negative amplitude curvatures and structural curvatures. In Figure 3, note that for both long and short wavelengths, most-positive estimates of amplitude-curvature (Figures 3a and 3c) provide considerable detail, whereas most-positive structure-curvature displays (Figures 3b and 3d) show larger-scale features. The same physics occurs for estimates of most-negative curvature – amplitude curvature (Figures 4a and 4c) depicts fine detail, but structural curvature (Figures 4b and 4d) shows larger features. Amplitude curvature is not a better seismic attribute than structural curvature; it is simply a different attribute. Although structural highs and reflection amplitude anomalies are mathematically independent, they may be coupled by geology. For example, gas trapped by structure may create a bright spot. In such a case, the second derivatives of structure curvature and reflection amplitude curvature may be related. When seismic data are processed with amplitude-preserving procedures, amplitude variations can be diagnostic of geologic information – such as changes in porosity, thickness or lithology. Computing curvature of reflection-amplitude gradients enhances the detection of gas-charged fractures, mineralized cleats in coal seams and other subtle features. We hope to extend the work shown here to generate rose diagrams of lineaments observed on amplitude-curvature maps and compare these with rose diagrams obtained from image logs. We thank Arcis Corporation for permission to show the data examples, as well as for the permission to publish this work.
Copyright © AAPG. Serial rights given by author. For all other rights contact author directly. |
 General statement