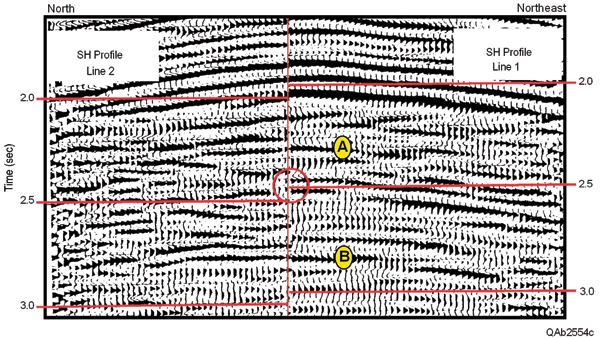
Figure 12. Comparison of event-aligned SH images across the targeted sandstone reservoir. The SH image on Line 1 is advanced in time so that there is a reasonable alignment of events A and B that span the reservoir interval, the interval circled at 2.5 s. Within this circled data window, the dimming on Line 2 means that the SH polarization on Line 2 is the slow-S mode for the fracture target. Because the SH polarization on Line 2 is east-west (Figure 10), then north-south fractures must be present within the reservoir interval for SH motion on Line 2 to be a slow-S mode. Modified from Alford and others (1989).