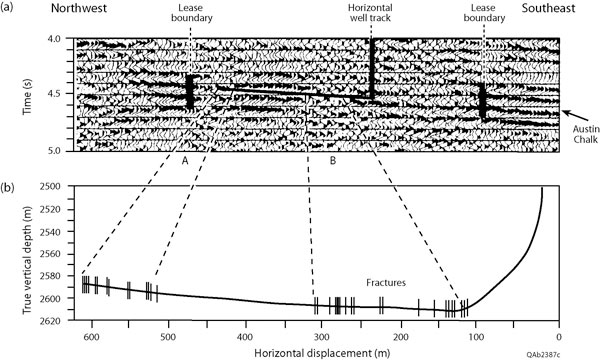
Figure 9. (a) S2 reflection profile across an Austin Chalk lease. The coordinates followed by the vertical and horizontal legs of an exploration well are superimposed on the seismic image, as are the locations of the lease boundaries. (b) Fractures found along the horizontal leg of the well were concentrated in the two zones, A and B, where the S2 reflection dimmed. Laboratory data discussed in preceding articles infer S2 velocity lowers (and thus S2 reflectivity decreases) when fracture density increases. That principle is now put into exploration practice. Data published by Mueller (1992).