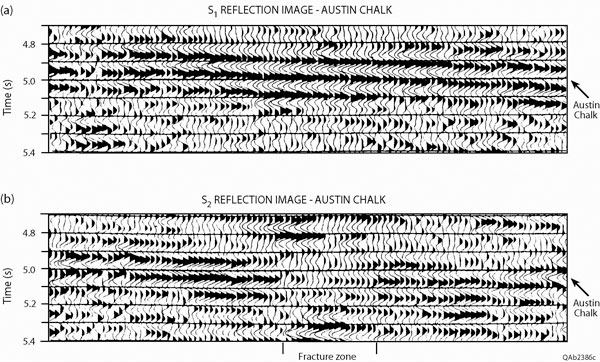
Figure 8. S1 and S2 images along a profile that traverses an Austin Chalk play. The S2 chalk reflection (b) is delayed by about 50 ms relative to the S1 reflection (a) because of the difference in S1 and S2 propagation velocities through the overburden above the chalk. From well control, it was determined that fracture zones occur where the S2 chalk reflection dims but the S1 reflection does not. Such S2 dimming is expected across fracture trends because S2 velocity in a zone of higher fracture density slows to almost equal the S-wave velocity in the top seal above the chalk. Data published by Mueller (1992).