Click image to view enlargement.
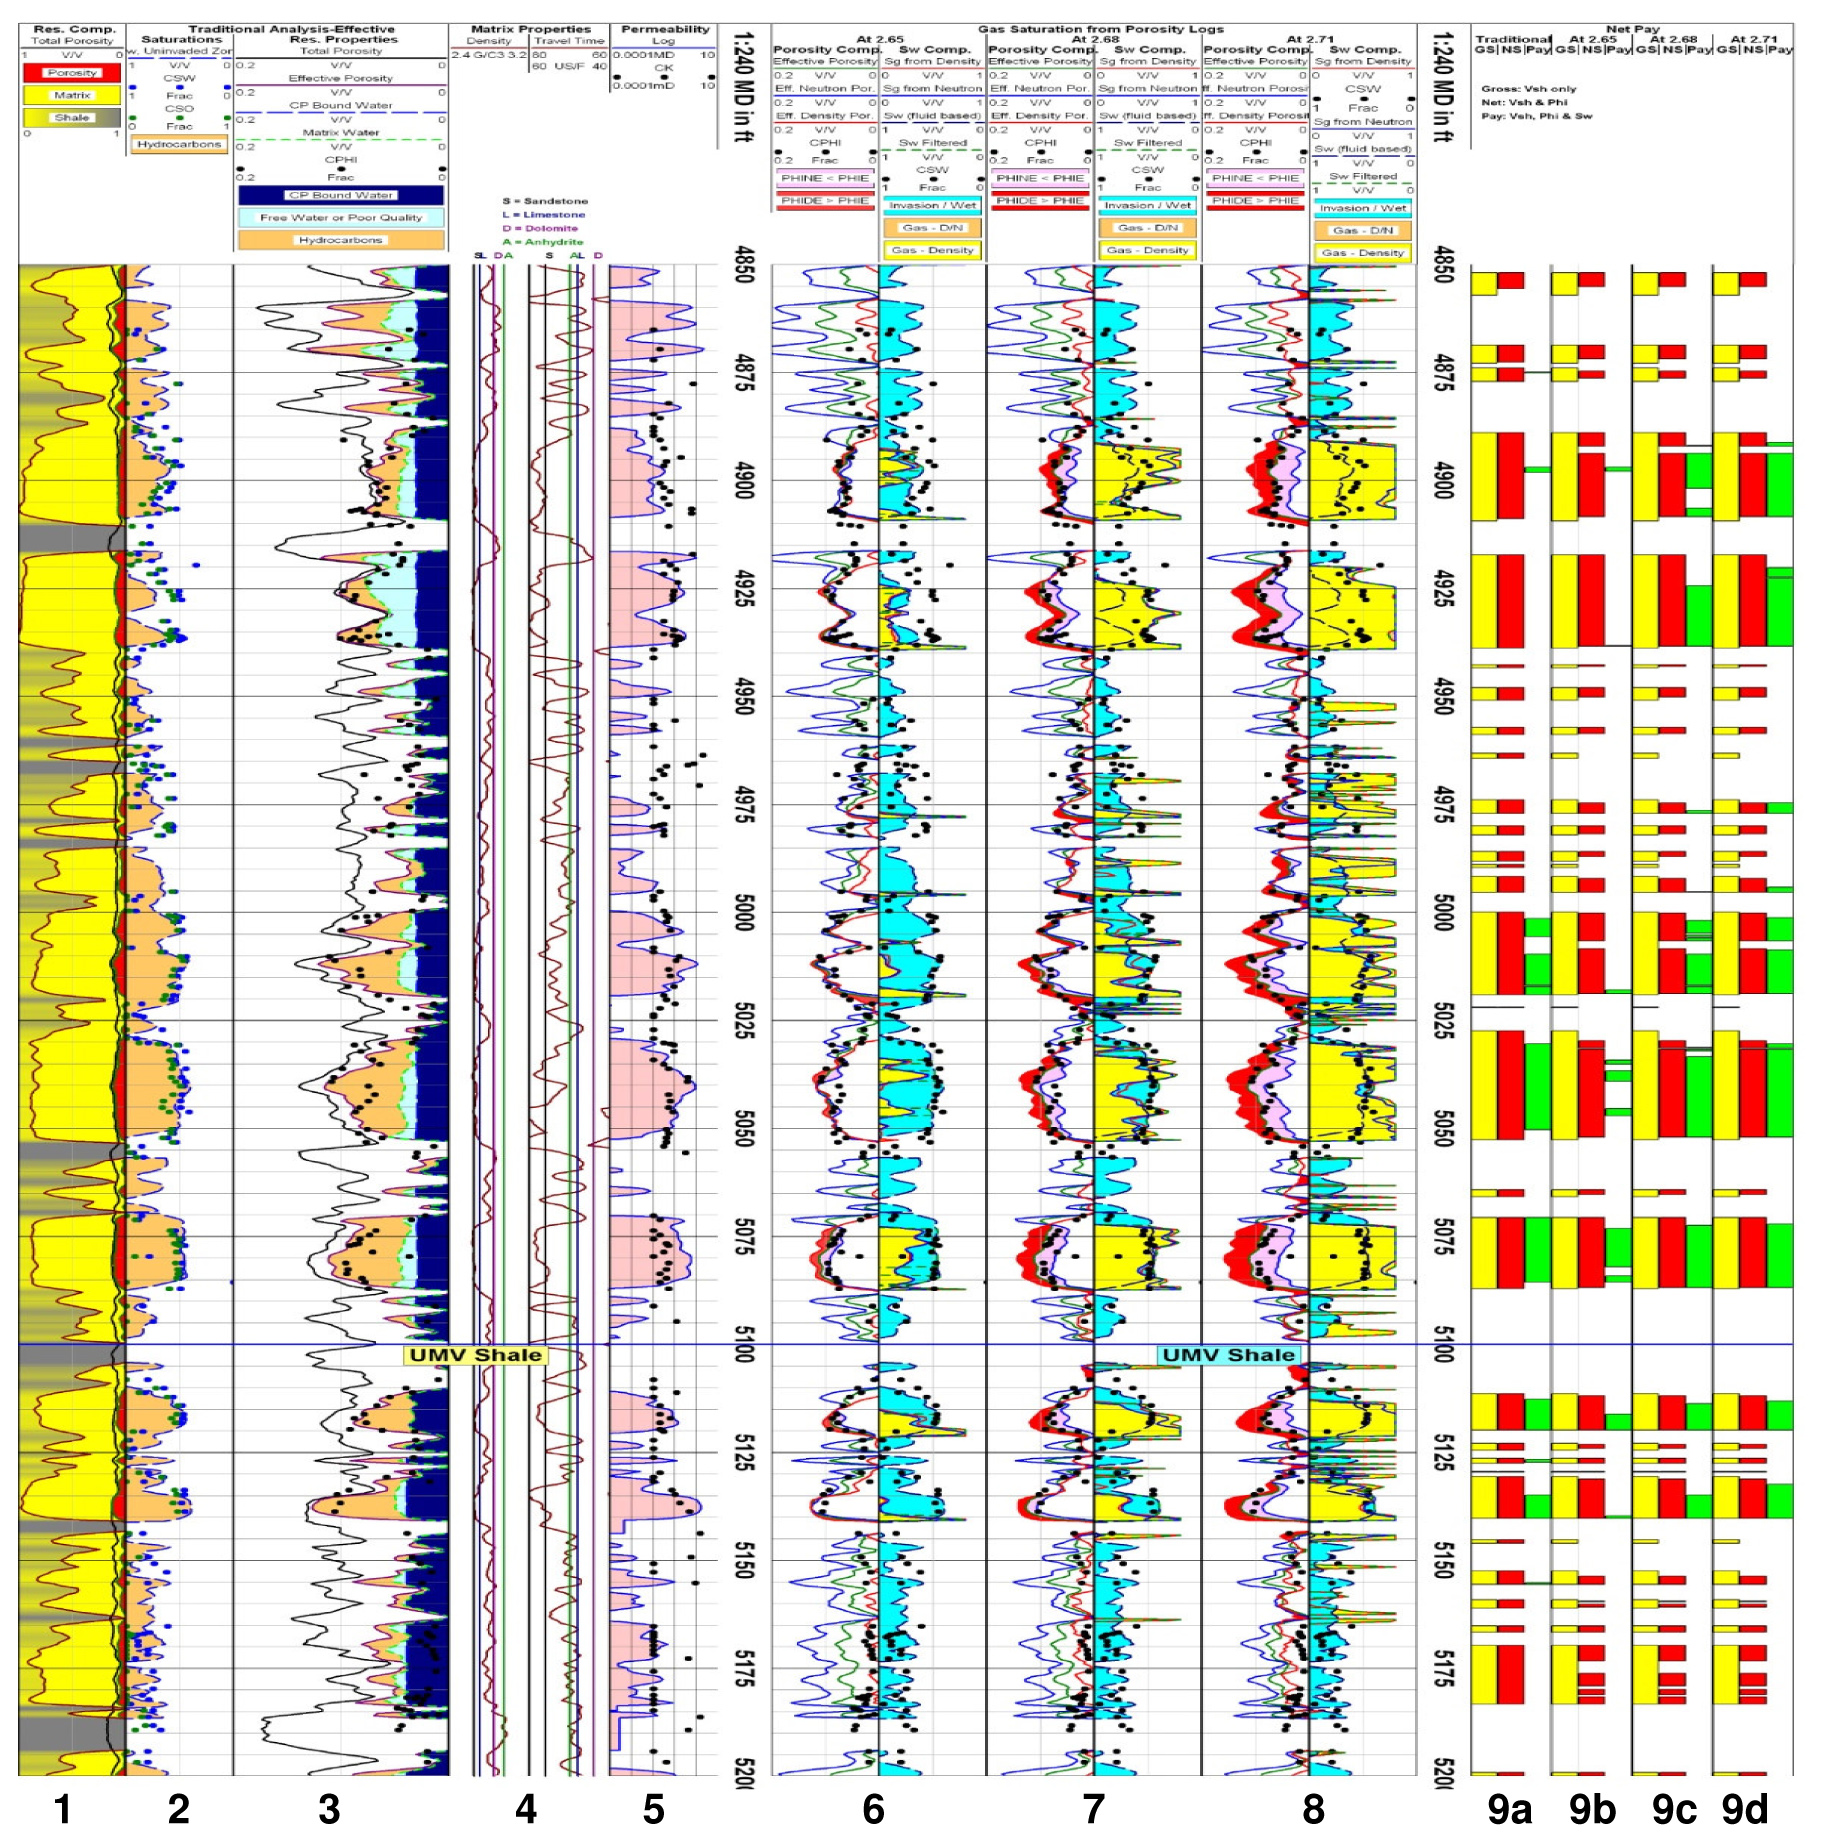
Figure 4. Depth log showing gas saturation from porosity log analysis. Track descriptions are as follows: (1) reservoir composition, where yellow indicates matrix, red indicates porosity, and grey indicates shale; (2) water saturation, core data illustrated by blue and green symbols; (3) bulk volumes, where grey indicates shale, brown indicates hydrocarbons, light blue indicates poor quality reservoir (possible mobile water), and dark blue indicates capillary bound water; (4) matrix properties - grain density and matrix travel time; (5) permeability, core data illustrated by black symbols. Tracks 6, 7, and 8 show porosity and gas saturation from porosity logs only. Yellow indicates gas saturation from porosity logs, and blue indicates water saturation from resistivity log analysis. Track 6 shows analysis assuming a grain density of 2.65 gm/cc, track 7 shows analysis assuming 2.68 gm/cc, and track 8 shows analysis assuming a grain density of 2.71 gm/cc. Track 9 contains pay flags where yellow indicates gross reservoir, red indicates net reservoir, and green indicates net pay. 9a shows pay flags from resistivity analysis, 9b shows pay flags from porosity log analysis assuming grain density of 2.65 gm/cc, 9c shows pay flags from porosity log analysis assuming grain density of 2.68 gm/cc, and 9d shows pay flags from porosity log analysis assuming grain density of 2.71 gm/cc.