Click image to view enlargement.
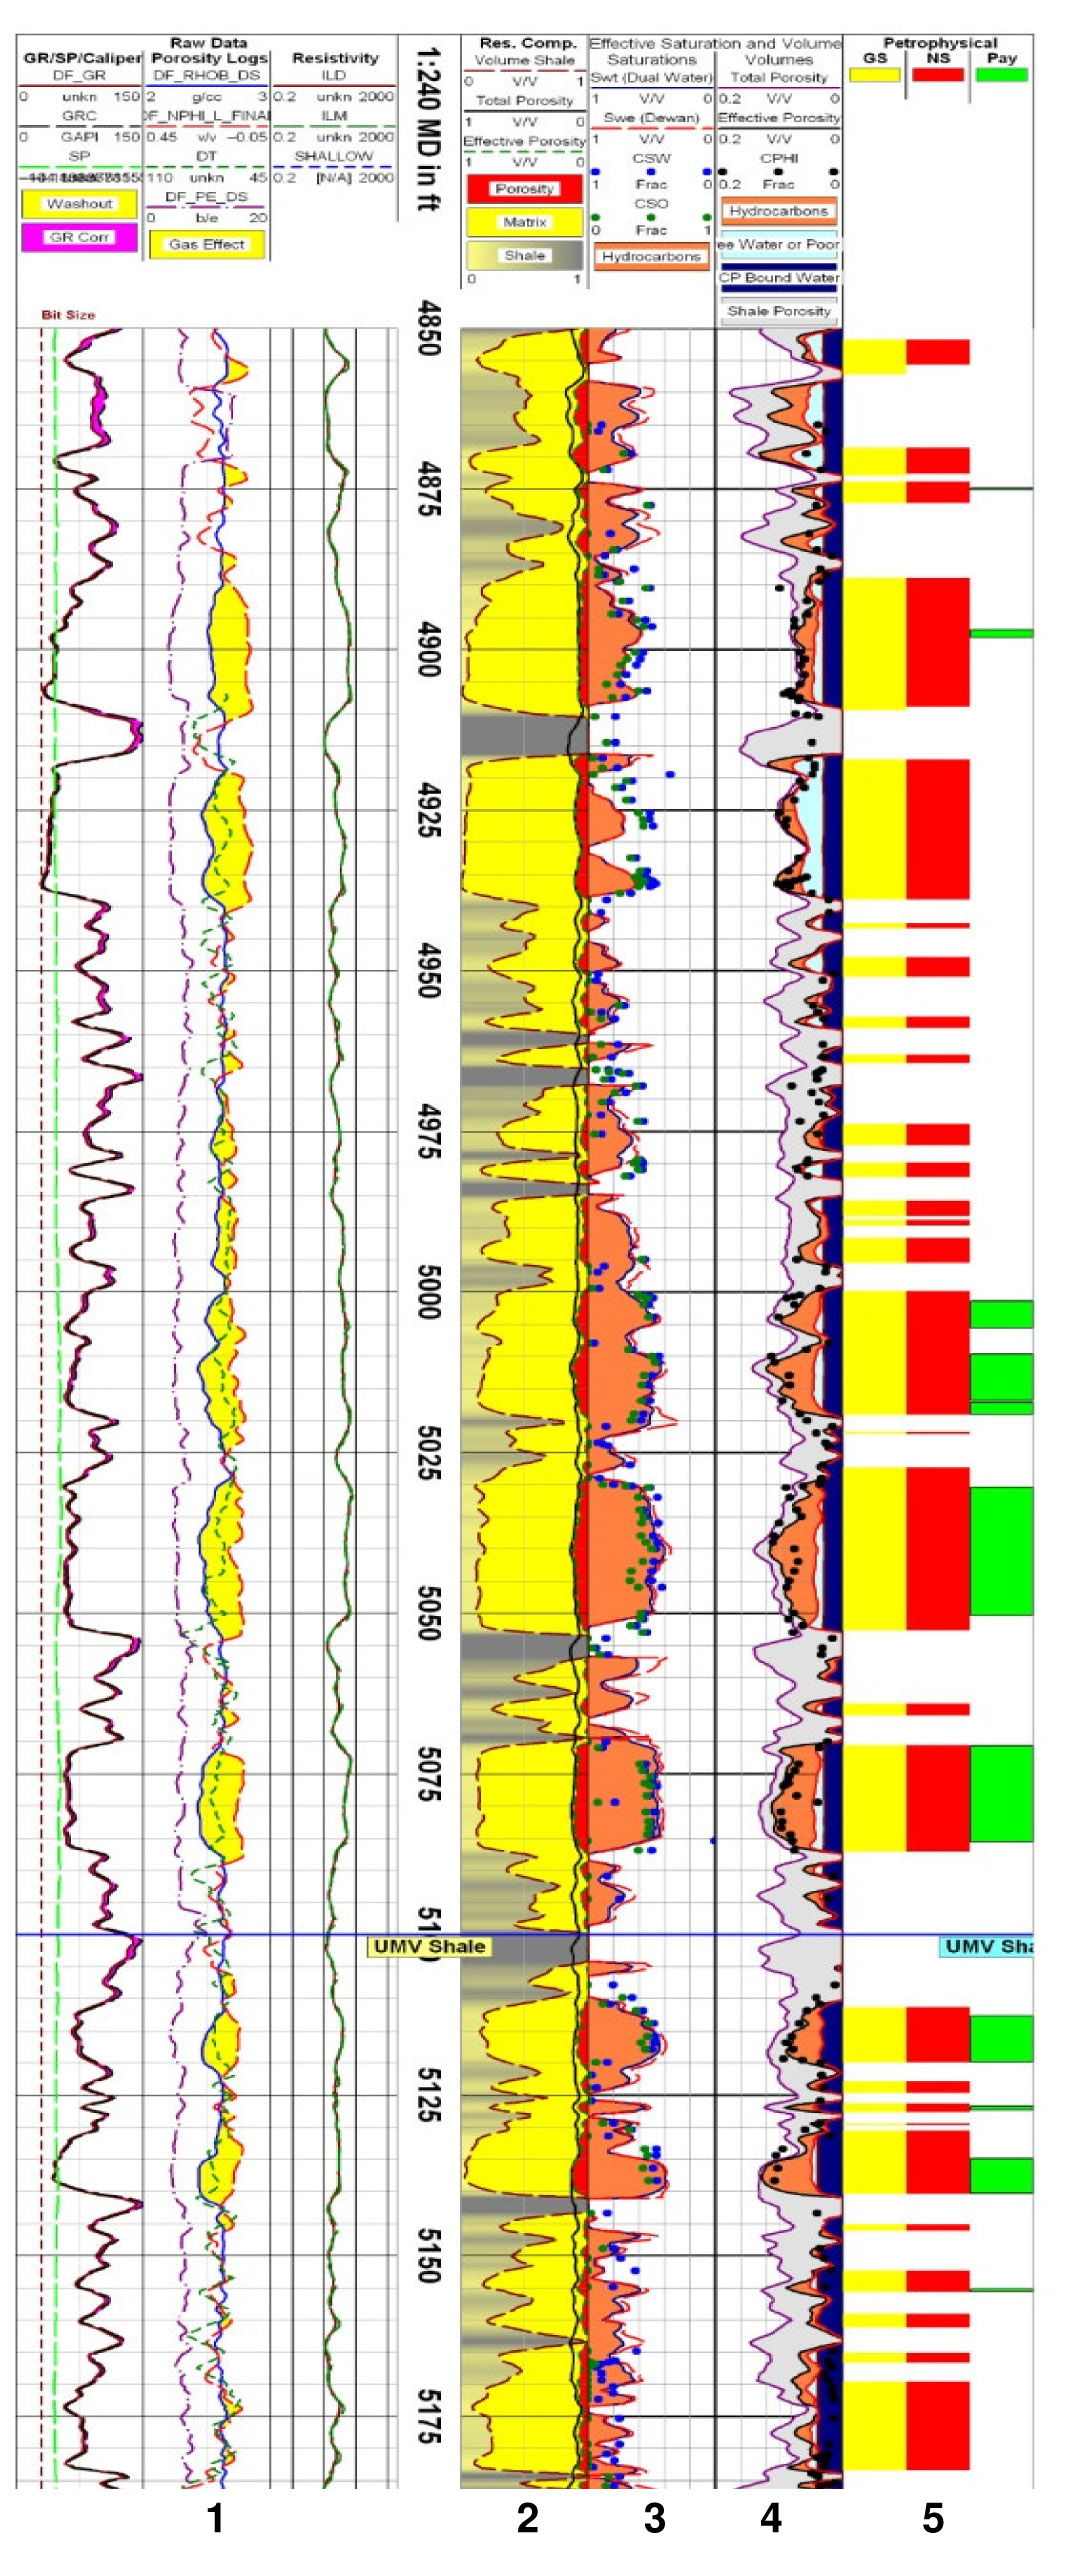
Figure 2. Depth log from standard shaley formation resistivity analysis. Track descriptions are as follows: (1) raw wireline log; (2) reservoir composition, where yellow indicates matrix, red indicates porosity, and grey indicates shale; (3) water saturation, core data illustrated by blue and green symbols; (4) bulk volumes where grey indicates shale, brown indicates hydrocarbons, light blue indicates poor quality reservoir (possible mobile water), and dark blue indicates capillary bound water; (5) pay flags where yellow indicates gross reservoir, red indicates net reservoir, and green indicates net pay.