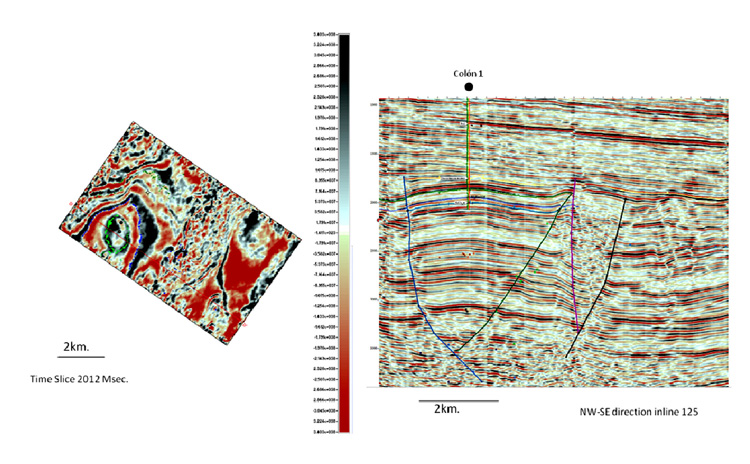
Figure 7. Seismic expression of Colon Oil Field. The left image is a time slice showing the four-dip closure with the Umir Sand Horizon in green. The right image shows the “pop up” anticline that forms the trap with the producing zone in blue.
Figure 7. Seismic expression of Colon Oil Field. The left image is a time slice showing the four-dip closure with the Umir Sand Horizon in green. The right image shows the “pop up” anticline that forms the trap with the producing zone in blue.