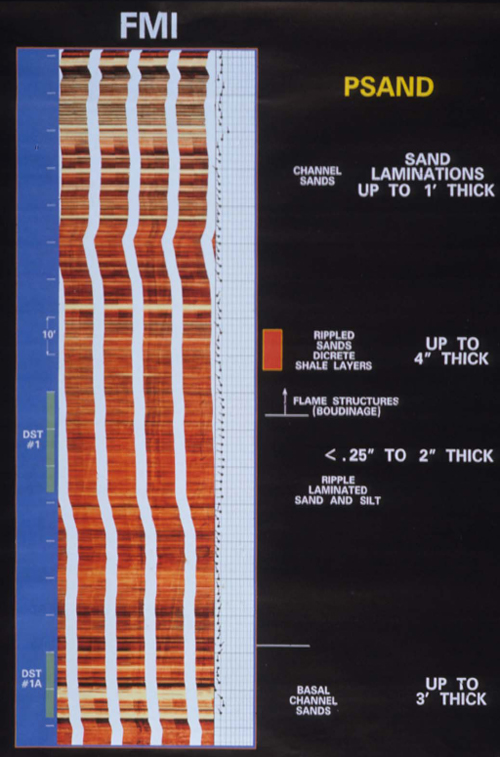
Figure 27. FMI images of P sand; highlighted interval (in red), of section higher in the section characterized by low-resistivity, shows flame structures in shale layers. Detail shown in Figure 28.
Figure 27. FMI images of P sand; highlighted interval (in red), of section higher in the section characterized by low-resistivity, shows flame structures in shale layers. Detail shown in Figure 28.