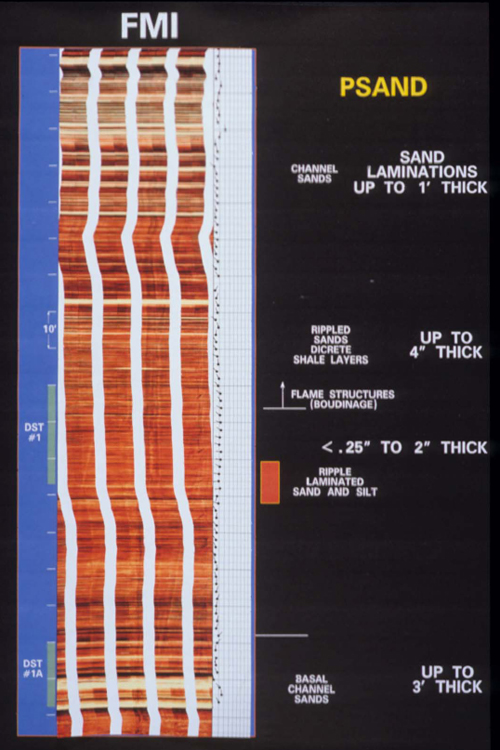
Figure 24. FMI images of the P sand interval, with part of the section characterized by low resistivity highlighted in red; this is the interval represented by Figure 25.
Figure 24. FMI images of the P sand interval, with part of the section characterized by low resistivity highlighted in red; this is the interval represented by Figure 25.