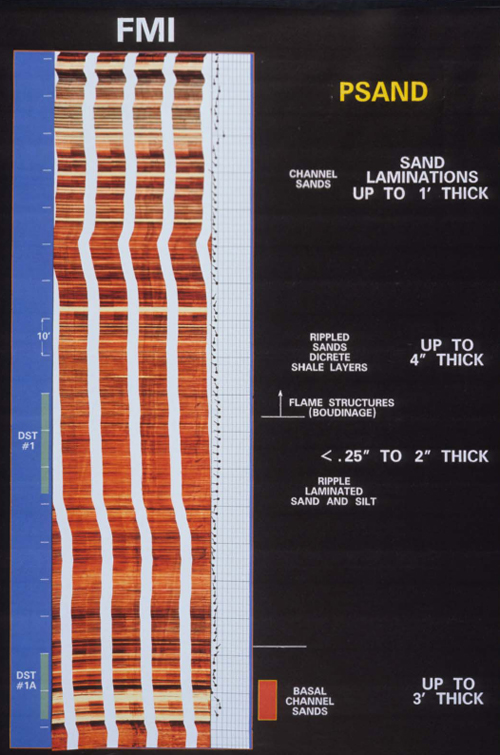
Figure 22. FMI images of the P sand interval with the section (from the lower part of the sand shown in Figure 23) highlighted in red.
Figure 22. FMI images of the P sand interval with the section (from the lower part of the sand shown in Figure 23) highlighted in red.